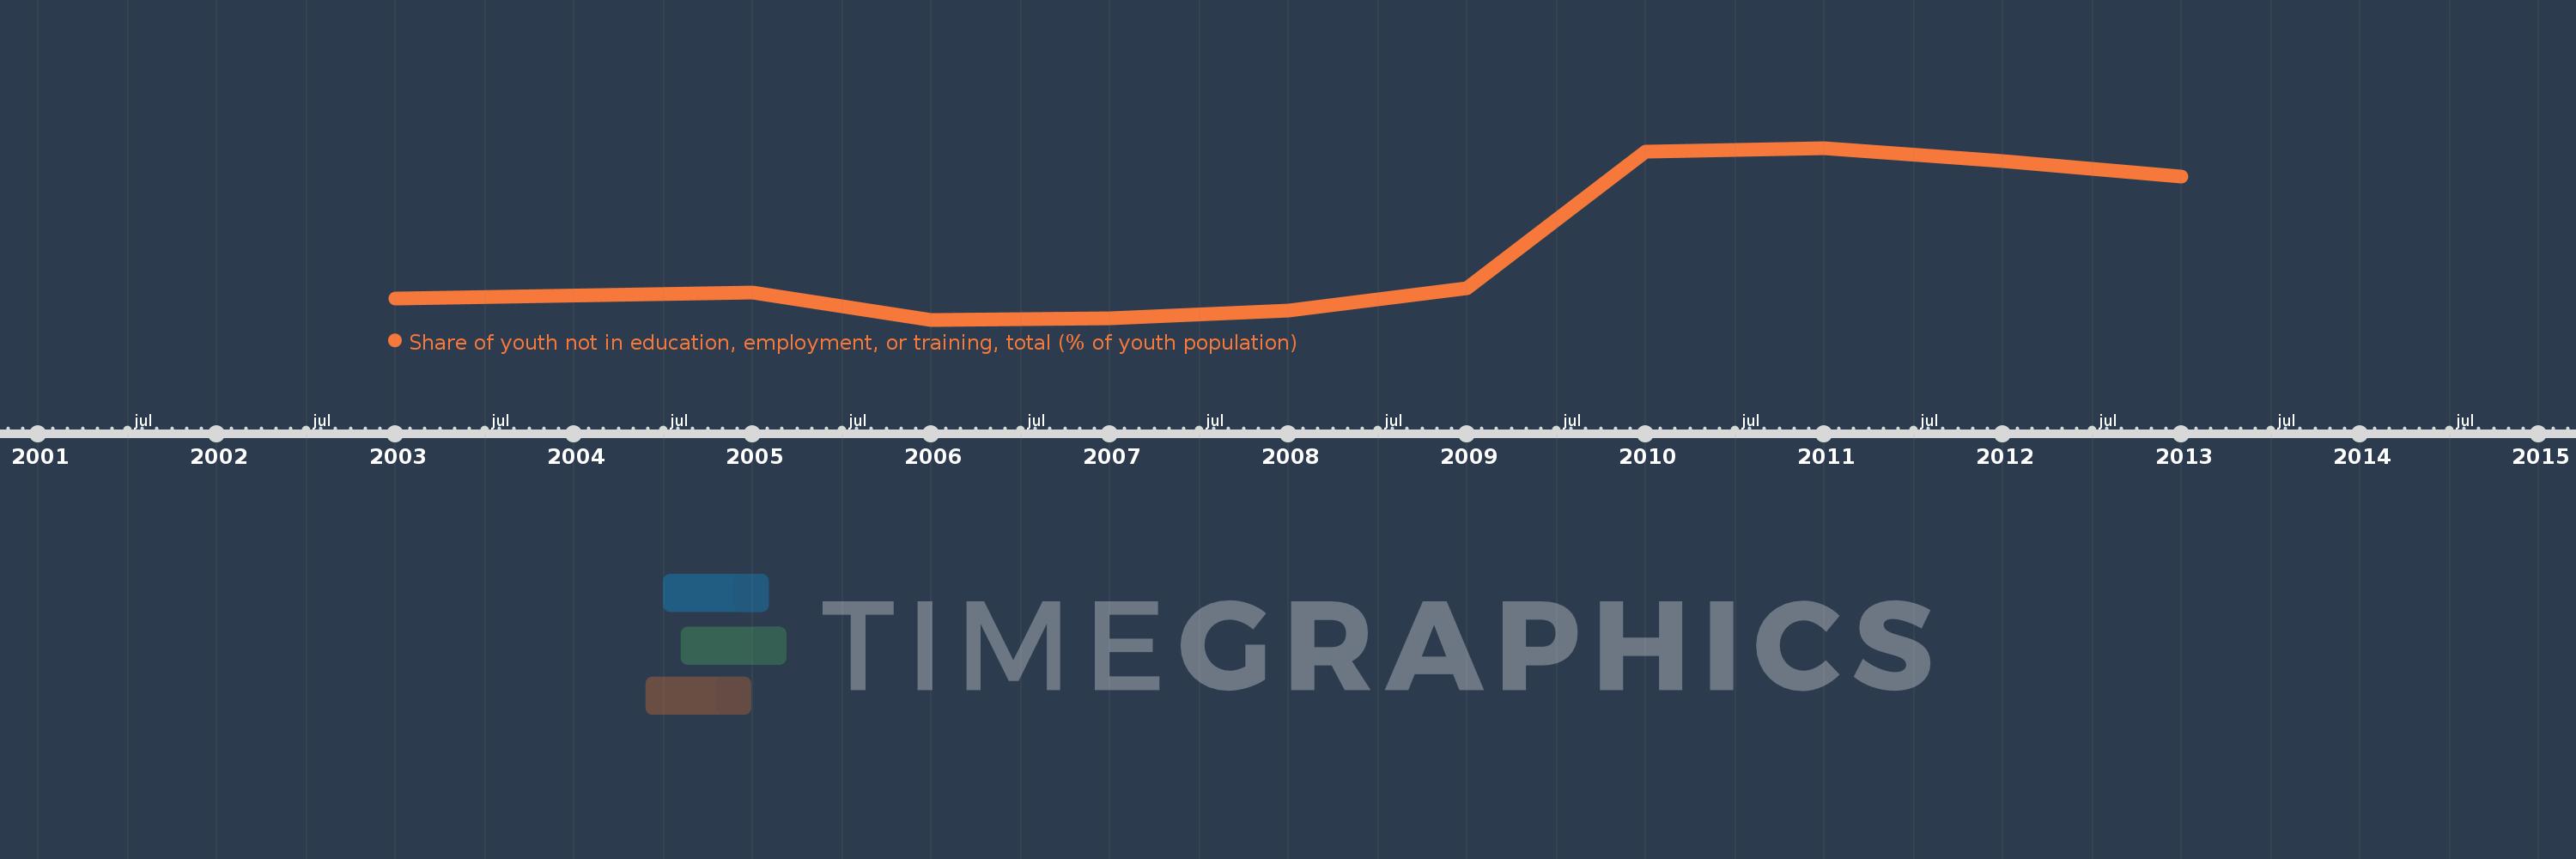
Questa scala temporale mostra un grafico dal 2003 anno al 2013 anno. North America. I dati fino ad 2002 anno non disponibili. Il numero di osservazioni attuali secondo i date: 10.
La fonte (nome):
Indicatori dello sviluppo mondiale
La fonte (organizzazione):
International Labour Organization, Key Indicators of the Labour Market database.
Categorie:
Social Protection & Labor
sono stati aggiornati
23 apr 2017 anni
Indicatori delle variazioni dei valori per anni
In media:
13.558
Minima:
10.785
1 gen 2006 anni
Massimo:
17.299
1 gen 2011 anni
Alla data di osservazione
Valore
Variazione assoluta
La variazione rispetto al valore precedente
1 gen 2003 anni
11.591
+11.591
0.0%
1 gen 2005 anni
11.814
+0.223
1.92%
1 gen 2006 anni
10.785
-1.028
-8.7%
1 gen 2007 anni
10.841
+0.056
0.52%
1 gen 2008 anni
11.125
+0.285
2.62%
1 gen 2009 anni
11.979
+0.854
7.67%
1 gen 2010 anni
17.147
+5.168
43.14%
1 gen 2011 anni
17.299
+0.152
0.89%
1 gen 2012 anni
16.79
-0.509
-2.95%
1 gen 2013 anni
16.214
-0.576
-3.43%
Classificazione dei paesi secondo i statistiche attuali per anni