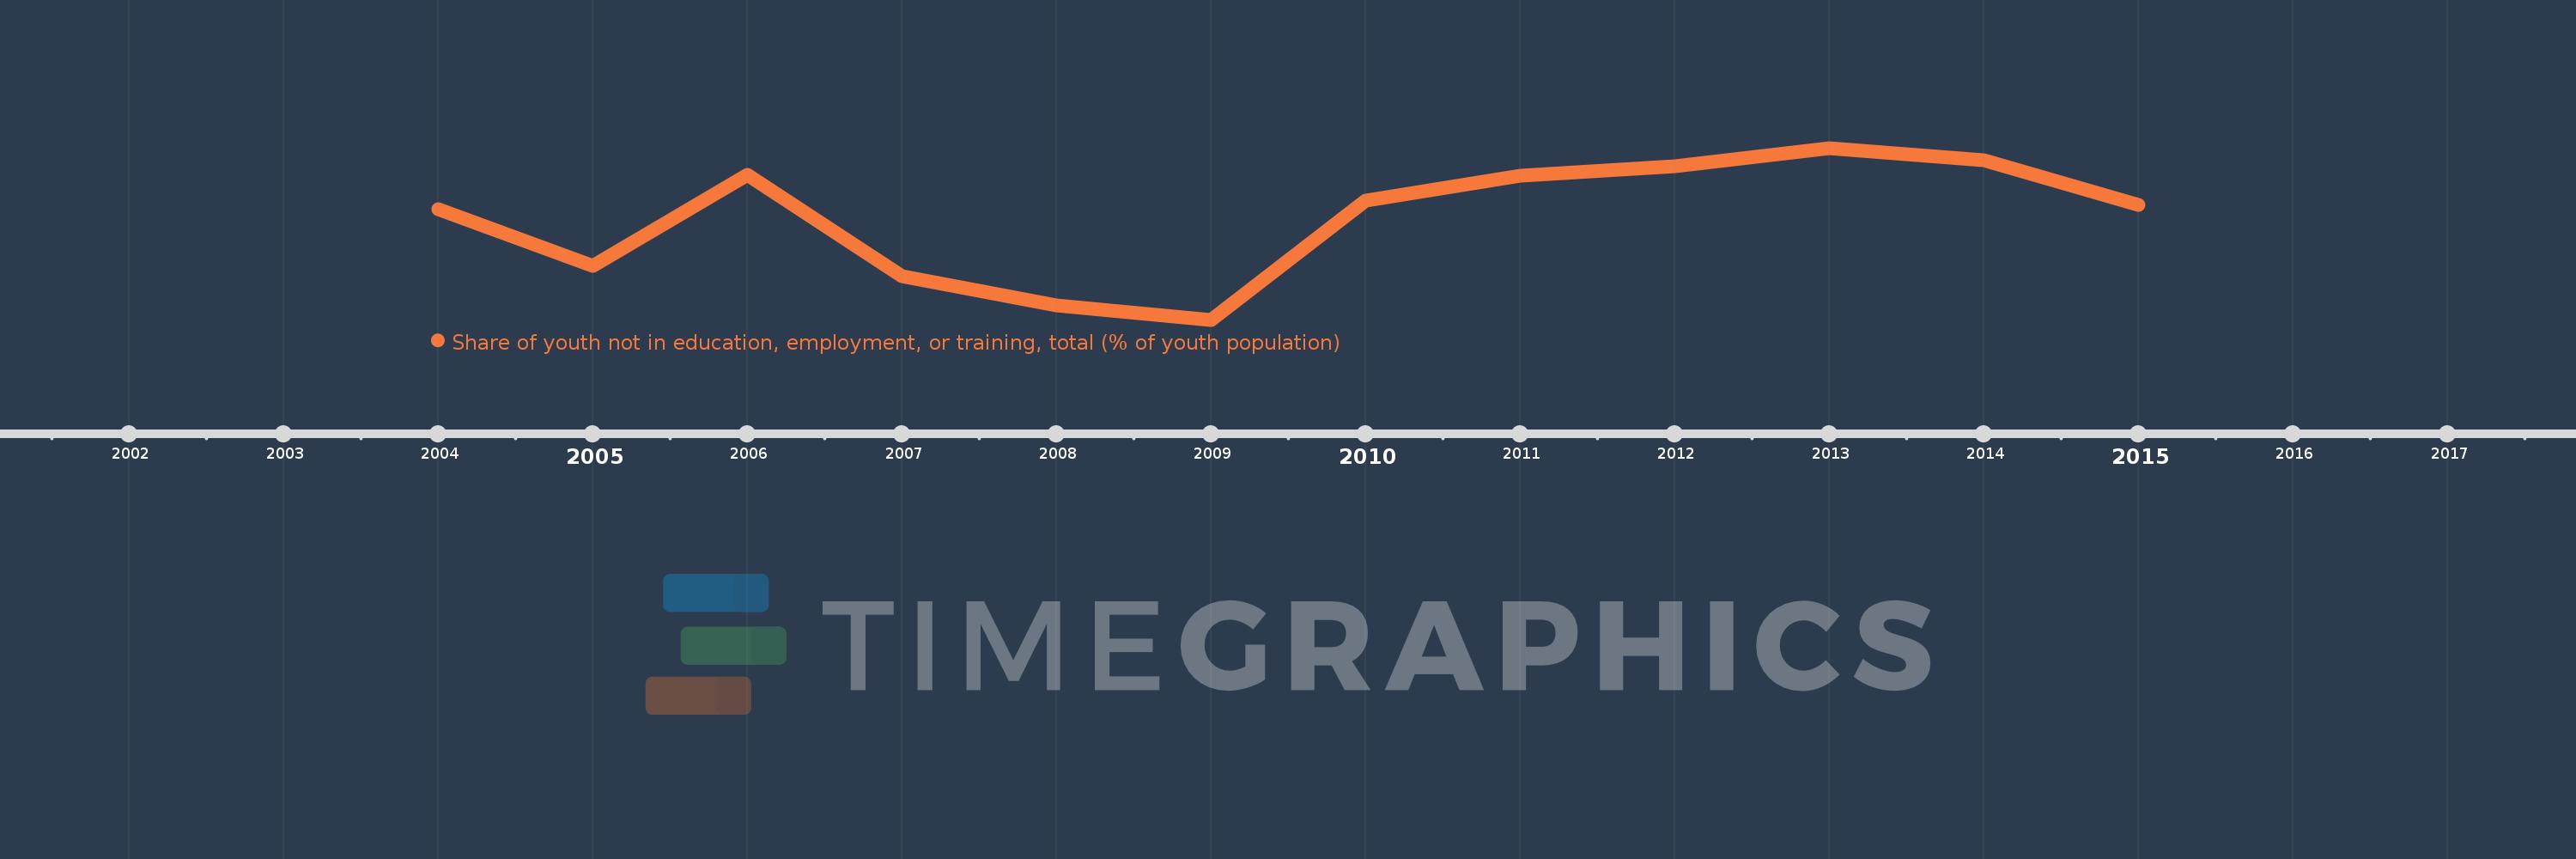
Questa scala temporale mostra un grafico dal 2004 anno al 2015 anno. European Union. I dati fino ad 2003 anno non disponibili. Il numero di osservazioni attuali secondo i date: 12.
La fonte (nome):
Indicatori dello sviluppo mondiale
La fonte (organizzazione):
International Labour Organization, Key Indicators of the Labour Market database.
Categorie:
Social Protection & Labor
sono stati aggiornati
23 apr 2017 anni
Indicatori delle variazioni dei valori per anni
In media:
12.17
Minima:
10.855
1 gen 2009 anni
Massimo:
13.06
1 gen 2013 anni
Alla data di osservazione
Valore
Variazione assoluta
La variazione rispetto al valore precedente
1 gen 2004 anni
12.276
+12.276
0.0%
1 gen 2005 anni
11.547
-0.729
-5.94%
1 gen 2006 anni
12.712
+1.164
10.08%
1 gen 2007 anni
11.416
-1.295
-10.19%
1 gen 2008 anni
11.037
-0.379
-3.32%
1 gen 2009 anni
10.855
-0.182
-1.65%
1 gen 2010 anni
12.387
+1.532
14.11%
1 gen 2011 anni
12.702
+0.315
2.54%
1 gen 2012 anni
12.821
+0.12
0.94%
1 gen 2013 anni
13.06
+0.238
1.86%
1 gen 2014 anni
12.898
-0.162
-1.24%
1 gen 2015 anni
12.332
-0.566
-4.39%
Classificazione dei paesi secondo i statistiche attuali per anni