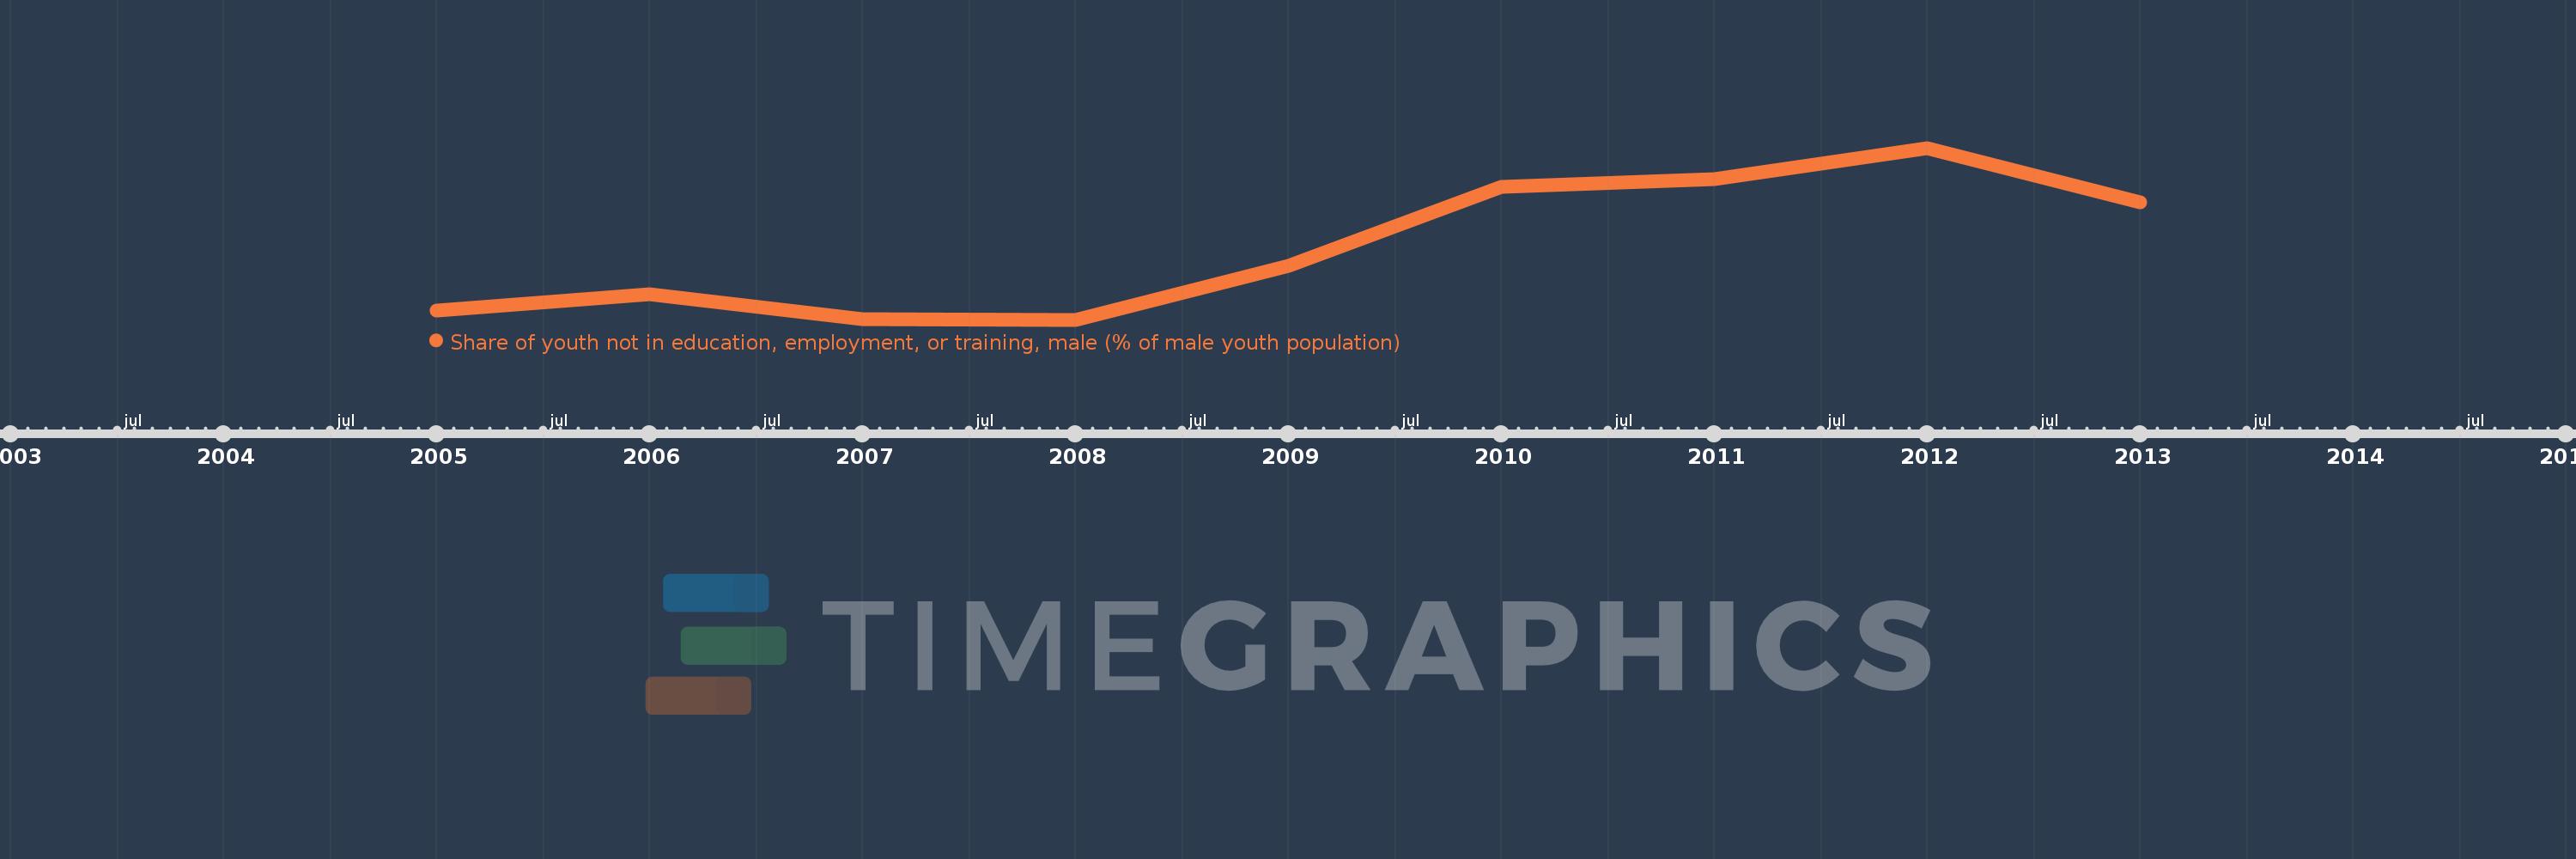
Questa scala temporale mostra un grafico dal 2005 anno al 2013 anno. Post-demographic dividend. I dati fino ad 2004 anno non disponibili. Il numero di osservazioni attuali secondo i date: 9.
La fonte (nome):
Indicatori dello sviluppo mondiale
La fonte (organizzazione):
International Labour Organization, Key Indicators of the Labour Market database.
Categorie:
Social Protection & Labor
sono stati aggiornati
23 apr 2017 anni
Indicatori delle variazioni dei valori per anni
In media:
11.377
Minima:
9.513
1 gen 2008 anni
Massimo:
13.937
1 gen 2012 anni
Alla data di osservazione
Valore
Variazione assoluta
La variazione rispetto al valore precedente
1 gen 2005 anni
9.746
+9.746
0.0%
1 gen 2006 anni
10.171
+0.425
4.36%
1 gen 2007 anni
9.523
-0.648
-6.37%
1 gen 2008 anni
9.513
-0.011
-0.11%
1 gen 2009 anni
10.889
+1.377
14.47%
1 gen 2010 anni
12.941
+2.051
18.84%
1 gen 2011 anni
13.129
+0.188
1.45%
1 gen 2012 anni
13.937
+0.808
6.16%
1 gen 2013 anni
12.545
-1.392
-9.99%
Classificazione dei paesi secondo i statistiche attuali per anni