33
/it/
AIzaSyB4mHJ5NPEv-XzF7P6NDYXjlkCWaeKw5bc
November 30, 2025
26139
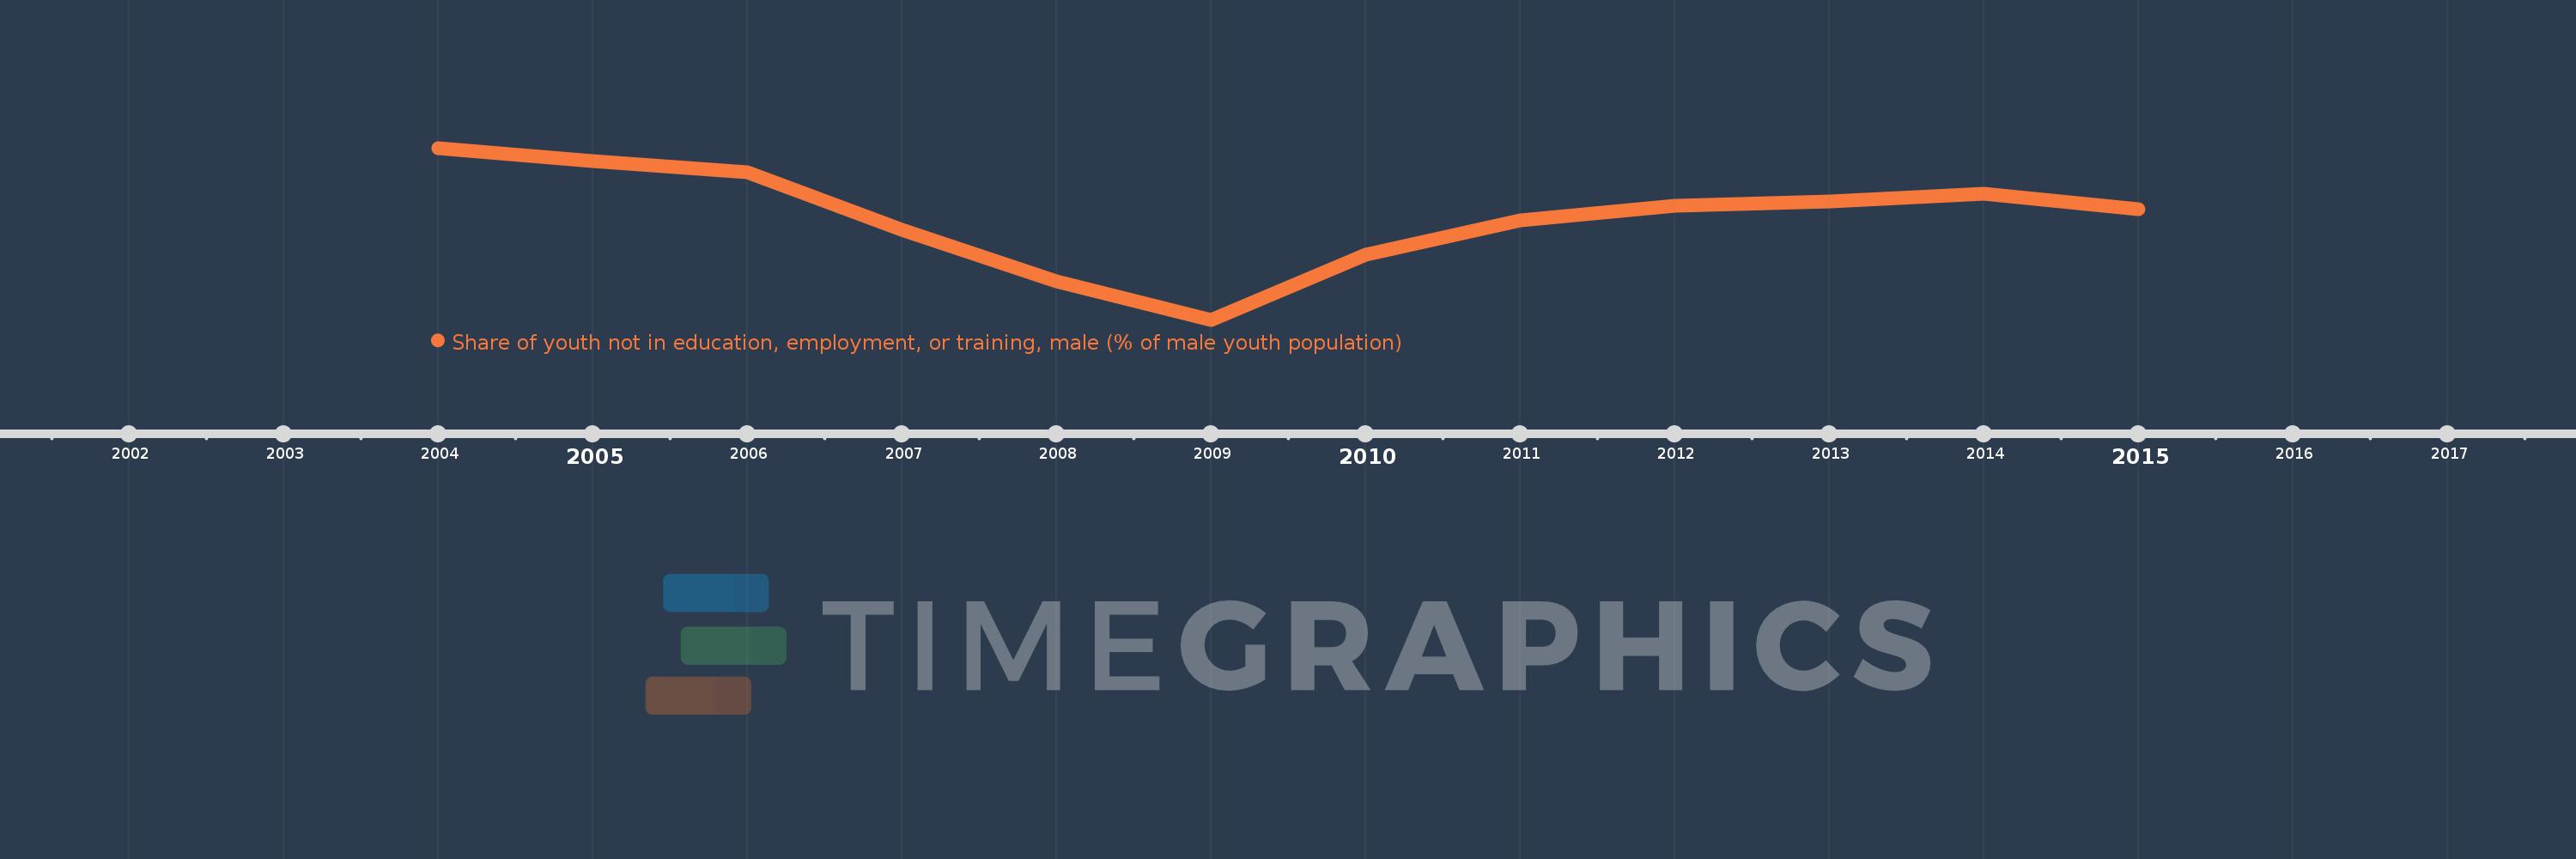
Central Europe and the Baltics
CEB
false
2
1
Share of youth not in education, employment, or training, male (% of male youth population)
2015,2014,2013,2012,2011,2010,2009,2008,2007,2006,2005,2004