Questa scala temporale mostra un grafico dal 2004 anno al 2015 anno. Euro area. I dati fino ad 2003 anno non disponibili. Il numero di osservazioni attuali secondo i date: 12.
La fonte (nome):
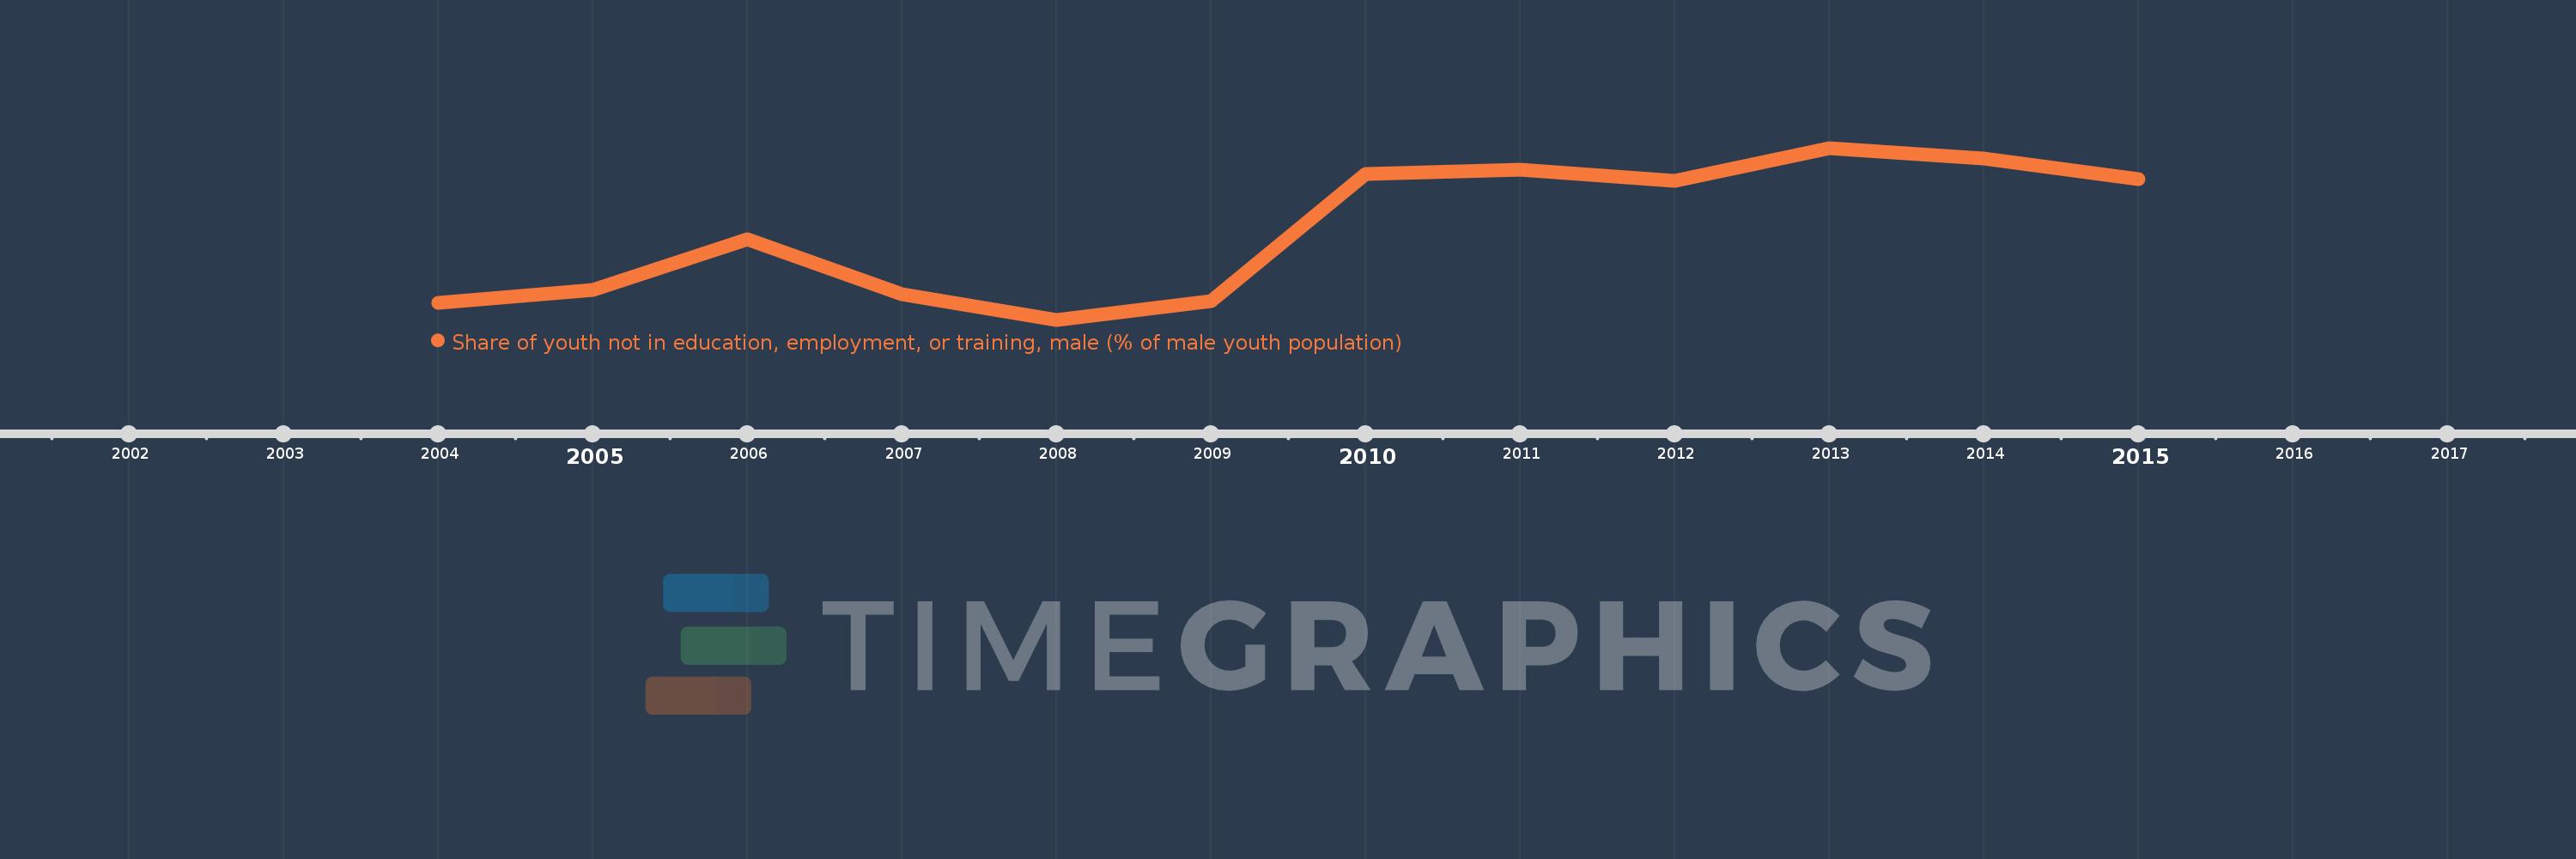
Indicatori dello sviluppo mondiale
La fonte (organizzazione):
International Labour Organization, Key Indicators of the Labour Market database.
Categorie:
Social Protection & Labor
sono stati aggiornati
23 apr 2017 anni
Indicatori delle variazioni dei valori per anni
In media:
11.495
Minima:
9.842
1 gen 2008 anni
Massimo:
12.997
1 gen 2013 anni
Alla data di osservazione
Valore
Variazione assoluta
La variazione rispetto al valore precedente
1 gen 2004 anni
10.153
+10.153
0.0%
1 gen 2005 anni
10.393
+0.24
2.37%
1 gen 2006 anni
11.317
+0.924
8.89%
1 gen 2007 anni
10.308
-1.009
-8.92%
1 gen 2008 anni
9.842
-0.466
-4.52%
1 gen 2009 anni
10.188
+0.346
3.52%
1 gen 2010 anni
12.525
+2.338
22.95%
1 gen 2011 anni
12.597
+0.072
0.57%
1 gen 2012 anni
12.392
-0.205
-1.63%
1 gen 2013 anni
12.997
+0.605
4.88%
1 gen 2014 anni
12.797
-0.2
-1.54%
1 gen 2015 anni
12.427
-0.37
-2.89%
Classificazione dei paesi secondo i statistiche attuali per anni