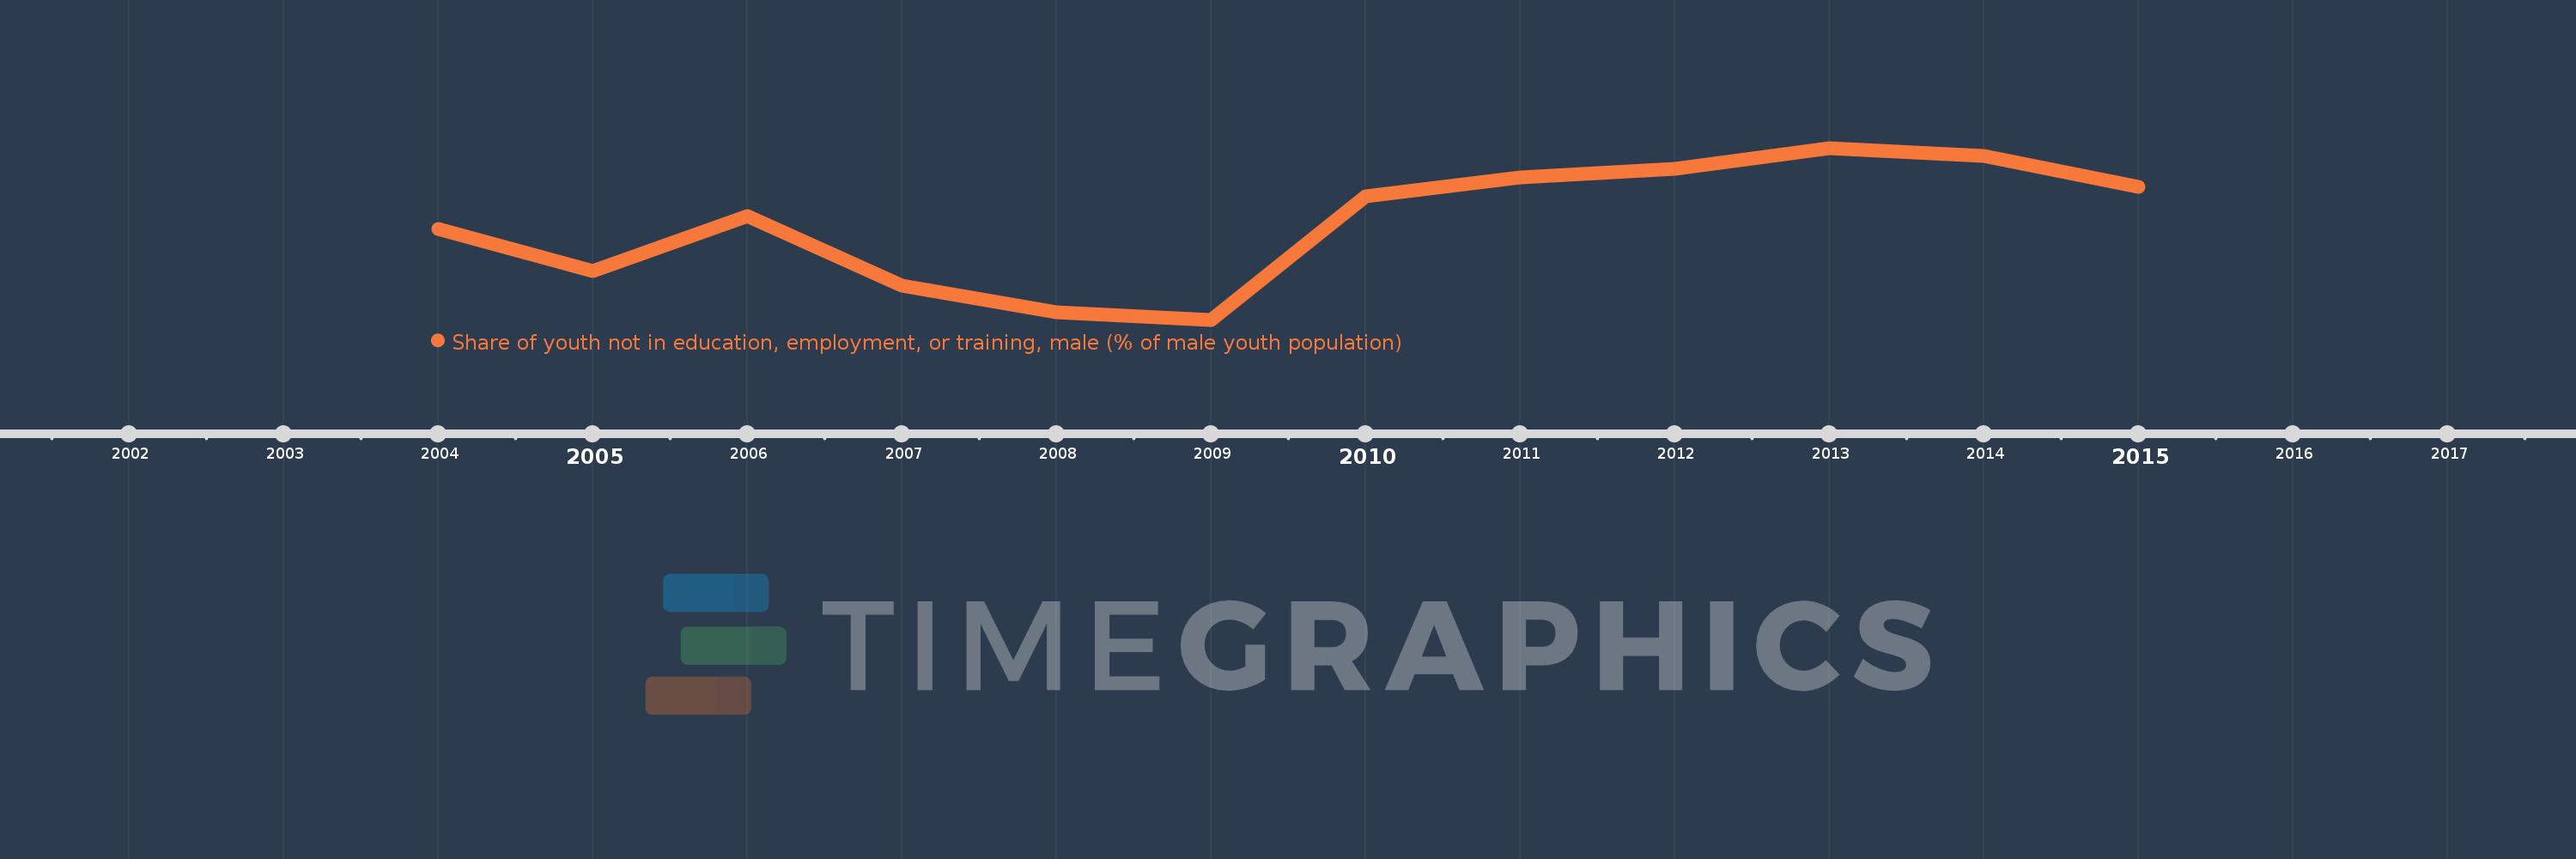
Questa scala temporale mostra un grafico dal 2004 anno al 2015 anno. European Union. I dati fino ad 2003 anno non disponibili. Il numero di osservazioni attuali secondo i date: 12.
La fonte (nome):
Indicatori dello sviluppo mondiale
La fonte (organizzazione):
International Labour Organization, Key Indicators of the Labour Market database.
Categorie:
Social Protection & Labor
sono stati aggiornati
23 apr 2017 anni
Indicatori delle variazioni dei valori per anni
In media:
11.475
Minima:
9.711
1 gen 2009 anni
Massimo:
12.821
1 gen 2013 anni
Alla data di osservazione
Valore
Variazione assoluta
La variazione rispetto al valore precedente
1 gen 2004 anni
11.349
+11.349
0.0%
1 gen 2005 anni
10.589
-0.76
-6.7%
1 gen 2006 anni
11.583
+0.994
9.39%
1 gen 2007 anni
10.333
-1.249
-10.79%
1 gen 2008 anni
9.849
-0.485
-4.69%
1 gen 2009 anni
9.711
-0.138
-1.4%
1 gen 2010 anni
11.953
+2.242
23.08%
1 gen 2011 anni
12.281
+0.328
2.75%
1 gen 2012 anni
12.445
+0.164
1.34%
1 gen 2013 anni
12.821
+0.376
3.02%
1 gen 2014 anni
12.672
-0.149
-1.16%
1 gen 2015 anni
12.121
-0.551
-4.35%
Classificazione dei paesi secondo i statistiche attuali per anni