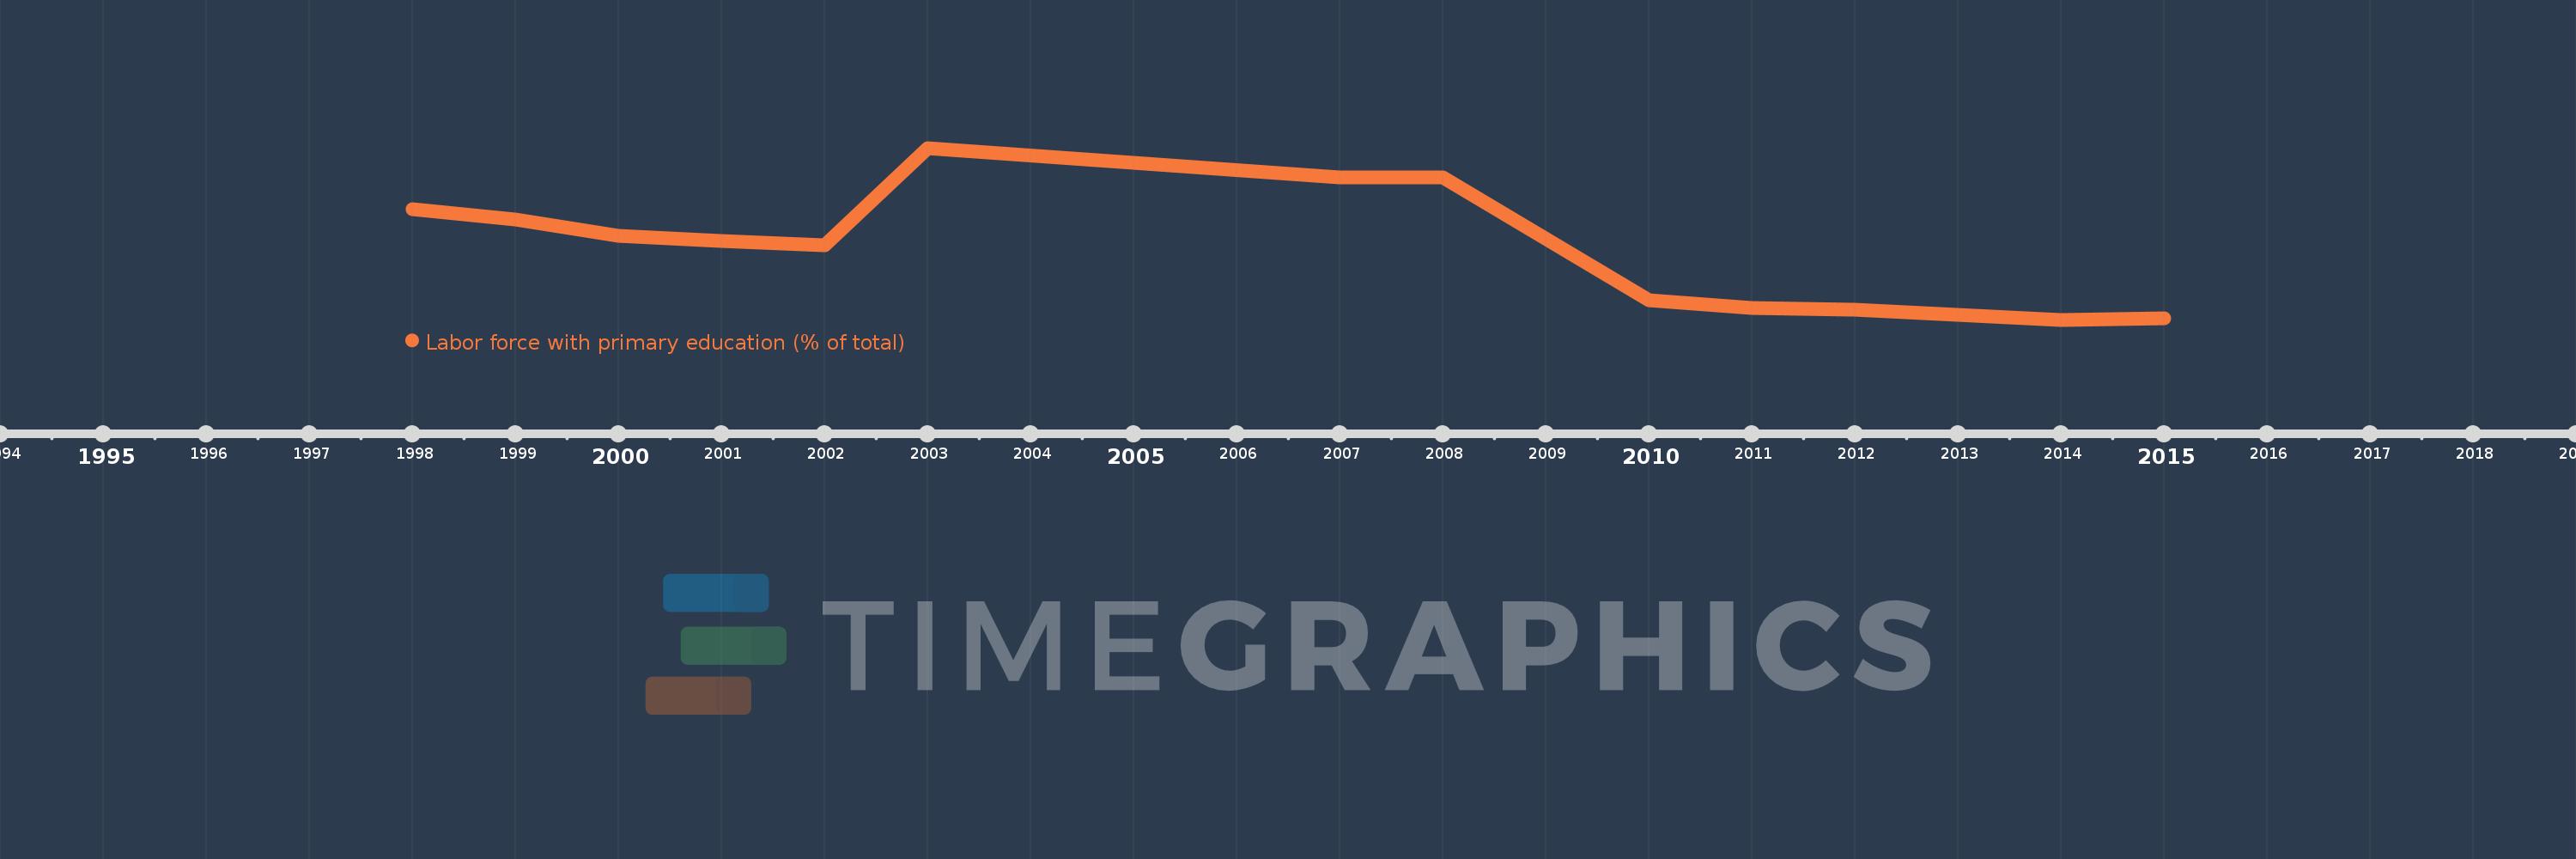
Questa scala temporale mostra un grafico dal 1998 anno al 2015 anno. High income. I dati fino ad 1997 anno non disponibili. Il numero di osservazioni attuali secondo i date: 14.
La fonte (nome):
Indicatori dello sviluppo mondiale
La fonte (organizzazione):
International Labour Organization, Key Indicators of the Labour Market database.
Categorie:
Education, Social Protection & Labor
sono stati aggiornati
23 apr 2017 anni
Indicatori delle variazioni dei valori per anni
In media:
20.624
Minima:
12.453
1 gen 2014 anni
Massimo:
33.068
1 gen 2003 anni
Alla data di osservazione
Valore
Variazione assoluta
La variazione rispetto al valore precedente
1 gen 1998 anni
25.714
+25.714
0.0%
1 gen 1999 anni
24.53
-1.184
-4.6%
1 gen 2000 anni
22.507
-2.023
-8.25%
1 gen 2001 anni
21.879
-0.629
-2.79%
1 gen 2002 anni
21.369
-0.51
-2.33%
1 gen 2003 anni
33.068
+11.699
54.75%
1 gen 2007 anni
29.575
-3.493
-10.56%
1 gen 2008 anni
29.567
-0.008
-0.03%
1 gen 2010 anni
14.77
-14.797
-50.05%
1 gen 2011 anni
13.906
-0.864
-5.85%
1 gen 2012 anni
13.654
-0.251
-1.81%
1 gen 2013 anni
13.071
-0.583
-4.27%
1 gen 2014 anni
12.453
-0.618
-4.73%
1 gen 2015 anni
12.67
+0.217
1.74%
Classificazione dei paesi secondo i statistiche attuali per anni