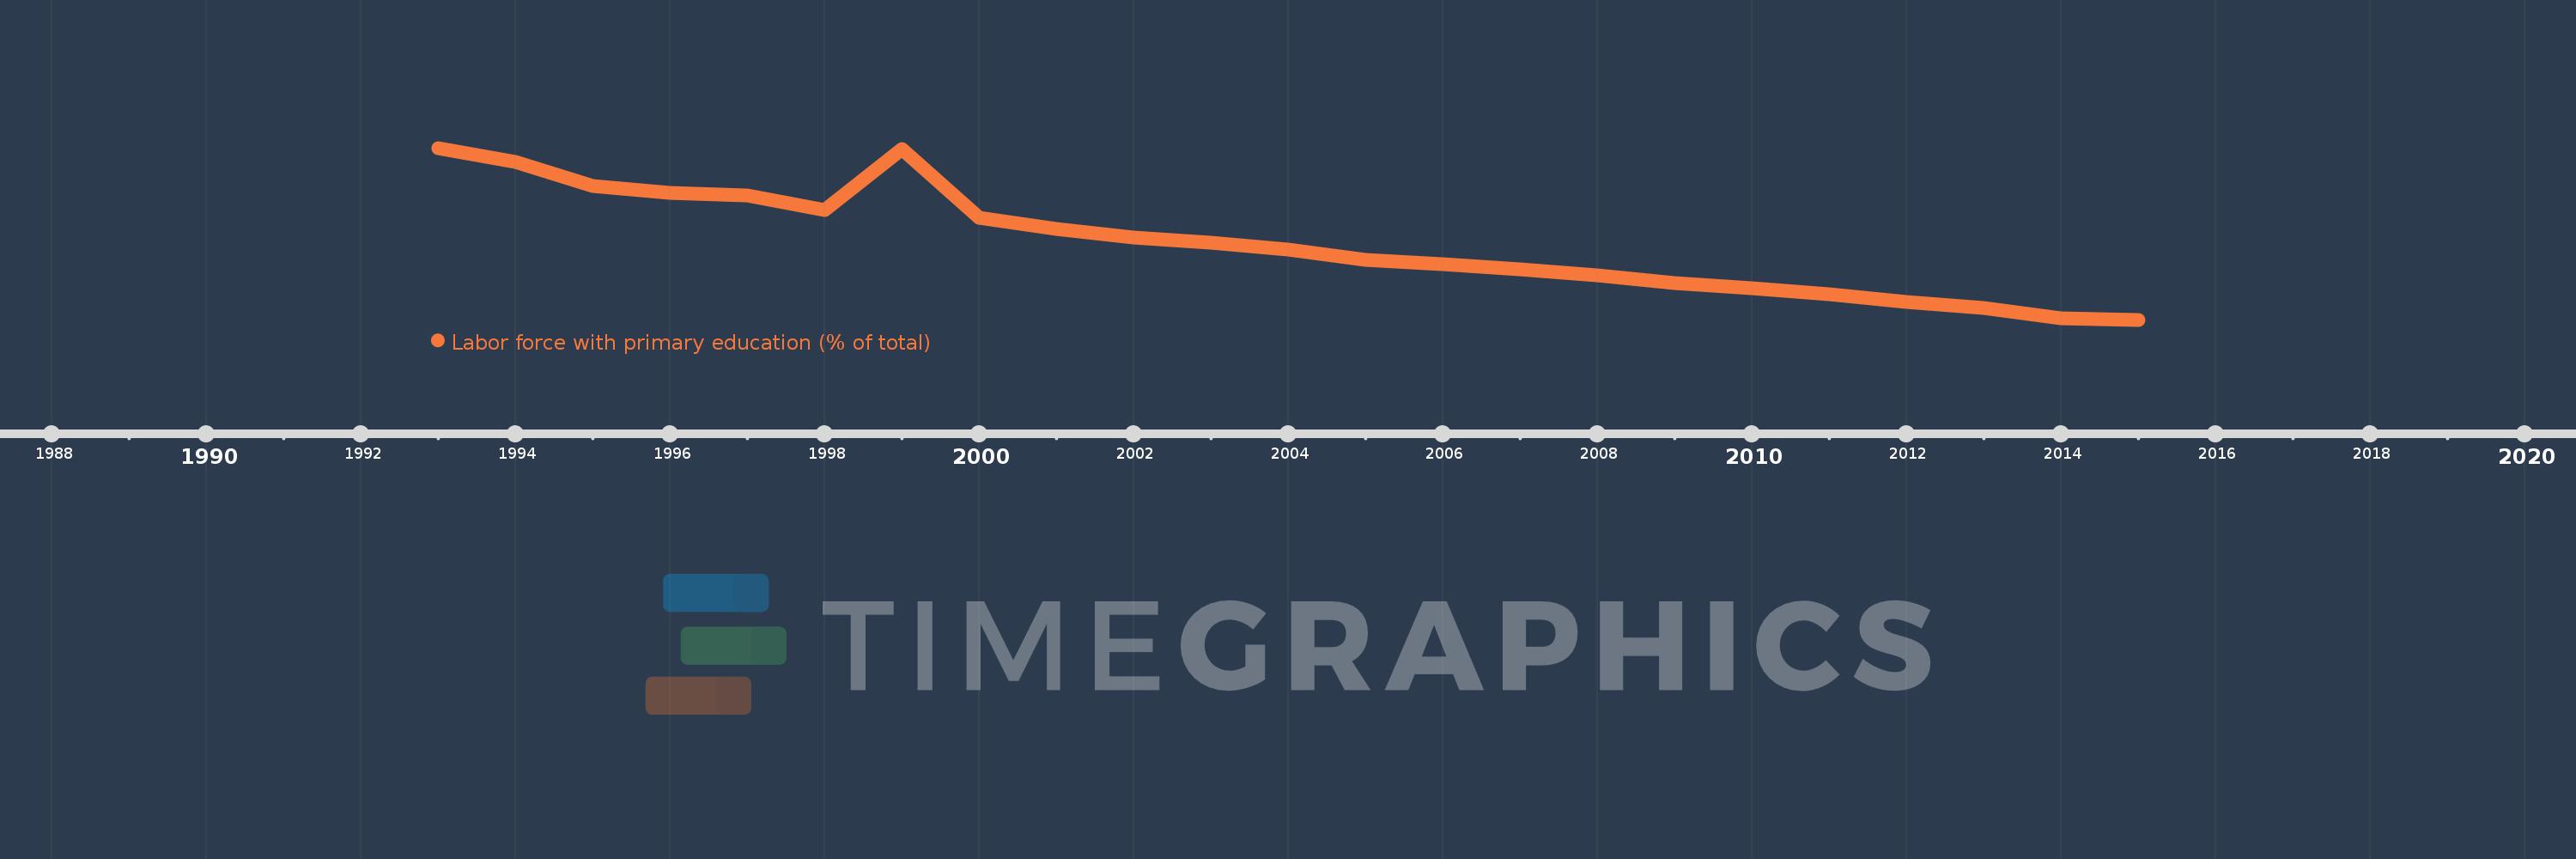
Questa scala temporale mostra un grafico dal 1993 anno al 2015 anno. Euro area. I dati fino ad 1992 anno non disponibili. Il numero di osservazioni attuali secondo i date: 23.
La fonte (nome):
Indicatori dello sviluppo mondiale
La fonte (organizzazione):
International Labour Organization, Key Indicators of the Labour Market database.
Categorie:
Education, Social Protection & Labor
sono stati aggiornati
23 apr 2017 anni
Indicatori delle variazioni dei valori per anni
In media:
31.741
Minima:
23.399
1 gen 2015 anni
Massimo:
42.224
1 gen 1993 anni
Alla data di osservazione
Valore
Variazione assoluta
La variazione rispetto al valore precedente
1 gen 1993 anni
42.224
+42.224
0.0%
1 gen 1994 anni
40.648
-1.576
-3.73%
1 gen 1995 anni
38.055
-2.593
-6.38%
1 gen 1996 anni
37.302
-0.753
-1.98%
1 gen 1997 anni
36.978
-0.324
-0.87%
1 gen 1998 anni
35.439
-1.538
-4.16%
1 gen 1999 anni
42.102
+6.663
18.8%
1 gen 2000 anni
34.54
-7.562
-17.96%
1 gen 2001 anni
33.348
-1.193
-3.45%
1 gen 2002 anni
32.369
-0.979
-2.94%
1 gen 2003 anni
31.836
-0.533
-1.65%
1 gen 2004 anni
31.073
-0.763
-2.4%
1 gen 2005 anni
29.985
-1.089
-3.5%
1 gen 2006 anni
29.443
-0.542
-1.81%
1 gen 2007 anni
28.96
-0.483
-1.64%
1 gen 2008 anni
28.22
-0.74
-2.56%
1 gen 2009 anni
27.437
-0.783
-2.77%
1 gen 2010 anni
26.825
-0.612
-2.23%
1 gen 2011 anni
26.209
-0.616
-2.3%
1 gen 2012 anni
25.316
-0.893
-3.41%
1 gen 2013 anni
24.728
-0.589
-2.33%
1 gen 2014 anni
23.605
-1.123
-4.54%
1 gen 2015 anni
23.399
-0.206
-0.87%
Classificazione dei paesi secondo i statistiche attuali per anni