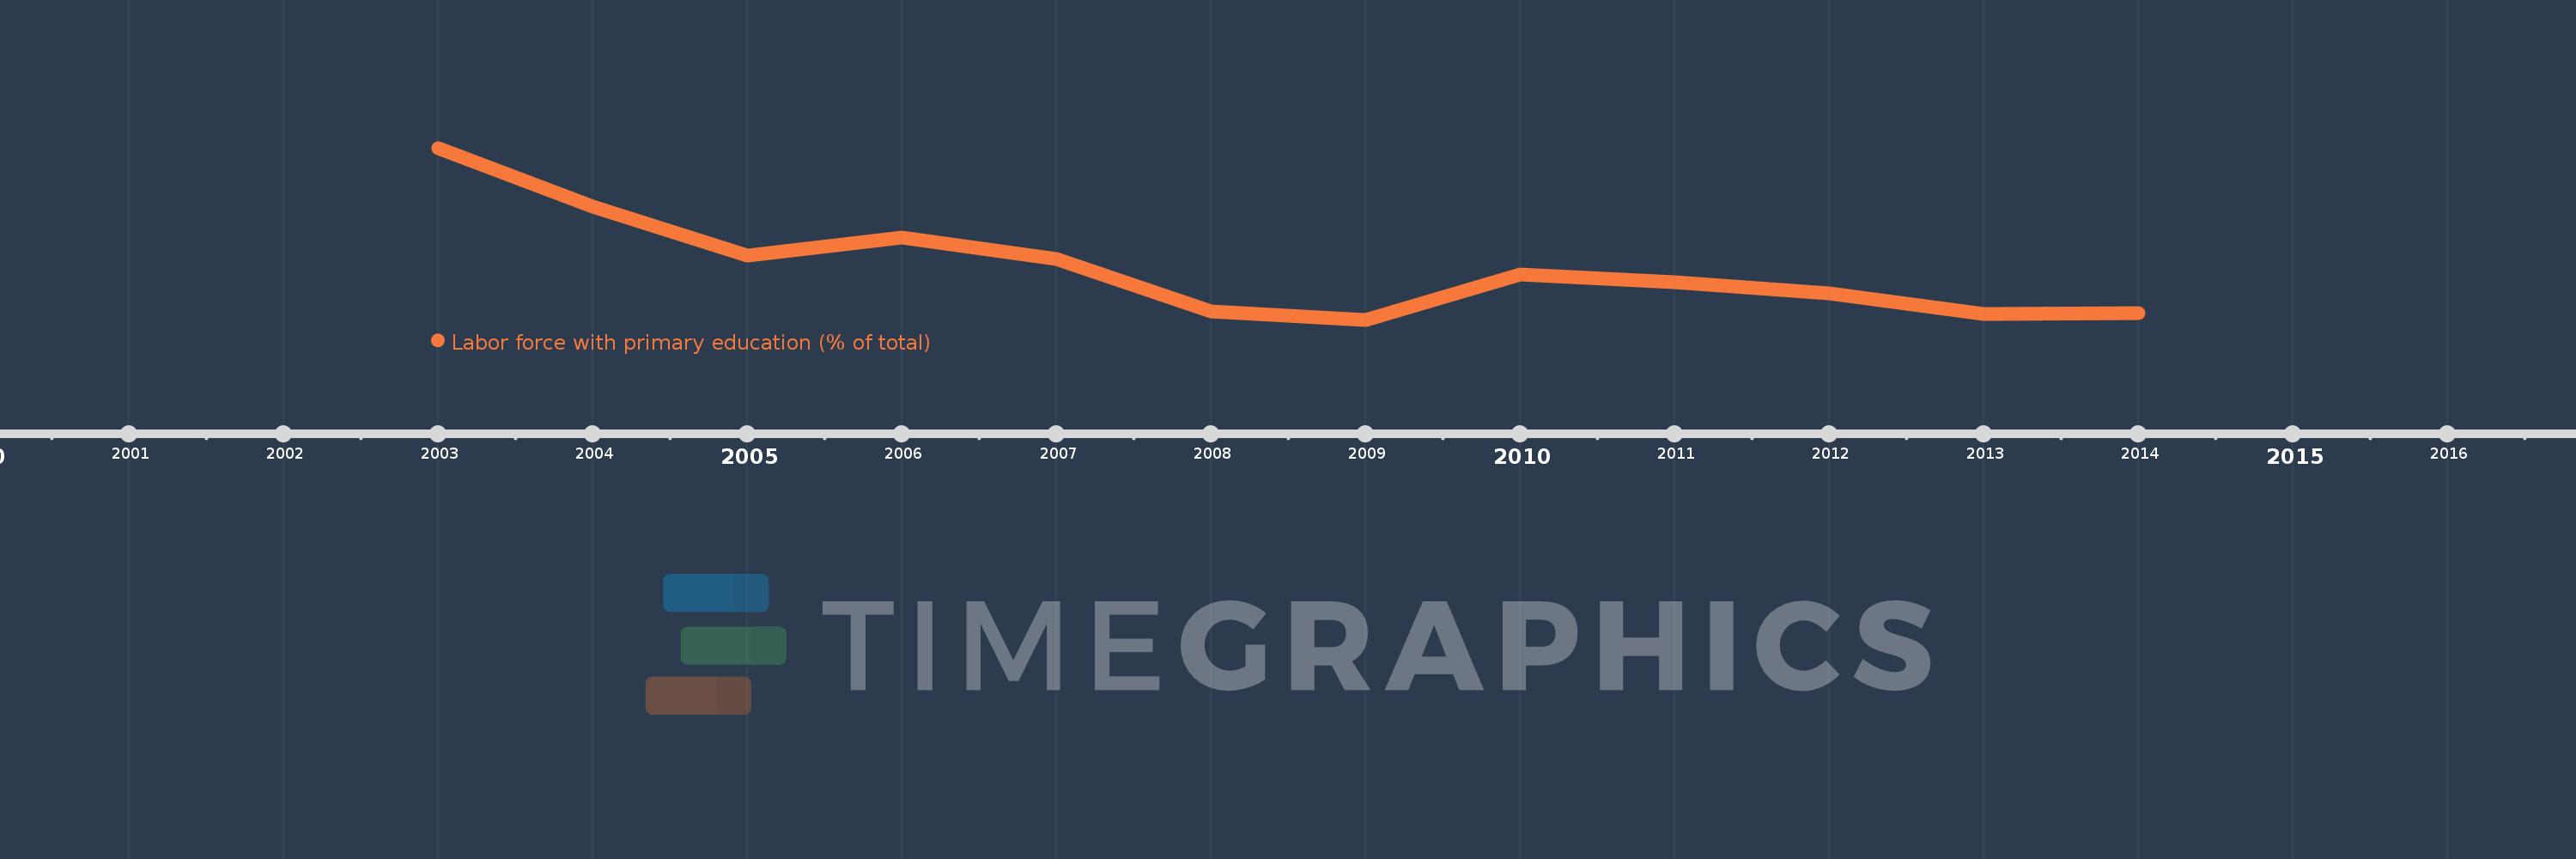
Questa scala temporale mostra un grafico dal 2003 anno al 2014 anno. Europe & Central Asia (IDA & IBRD countries). I dati fino ad 2002 anno non disponibili. Il numero di osservazioni attuali secondo i date: 12.
La fonte (nome):
Indicatori dello sviluppo mondiale
La fonte (organizzazione):
International Labour Organization, Key Indicators of the Labour Market database.
Categorie:
Education, Social Protection & Labor
sono stati aggiornati
23 apr 2017 anni
Indicatori delle variazioni dei valori per anni
In media:
17.886
Minima:
16.431
1 gen 2009 anni
Massimo:
21.26
1 gen 2003 anni
Alla data di osservazione
Valore
Variazione assoluta
La variazione rispetto al valore precedente
1 gen 2003 anni
21.26
+21.26
0.0%
1 gen 2004 anni
19.601
-1.658
-7.8%
1 gen 2005 anni
18.233
-1.368
-6.98%
1 gen 2006 anni
18.741
+0.508
2.78%
1 gen 2007 anni
18.134
-0.607
-3.24%
1 gen 2008 anni
16.667
-1.467
-8.09%
1 gen 2009 anni
16.431
-0.236
-1.42%
1 gen 2010 anni
17.713
+1.282
7.8%
1 gen 2011 anni
17.484
-0.229
-1.29%
1 gen 2012 anni
17.172
-0.311
-1.78%
1 gen 2013 anni
16.587
-0.585
-3.41%
1 gen 2014 anni
16.608
+0.021
0.13%
Classificazione dei paesi secondo i statistiche attuali per anni