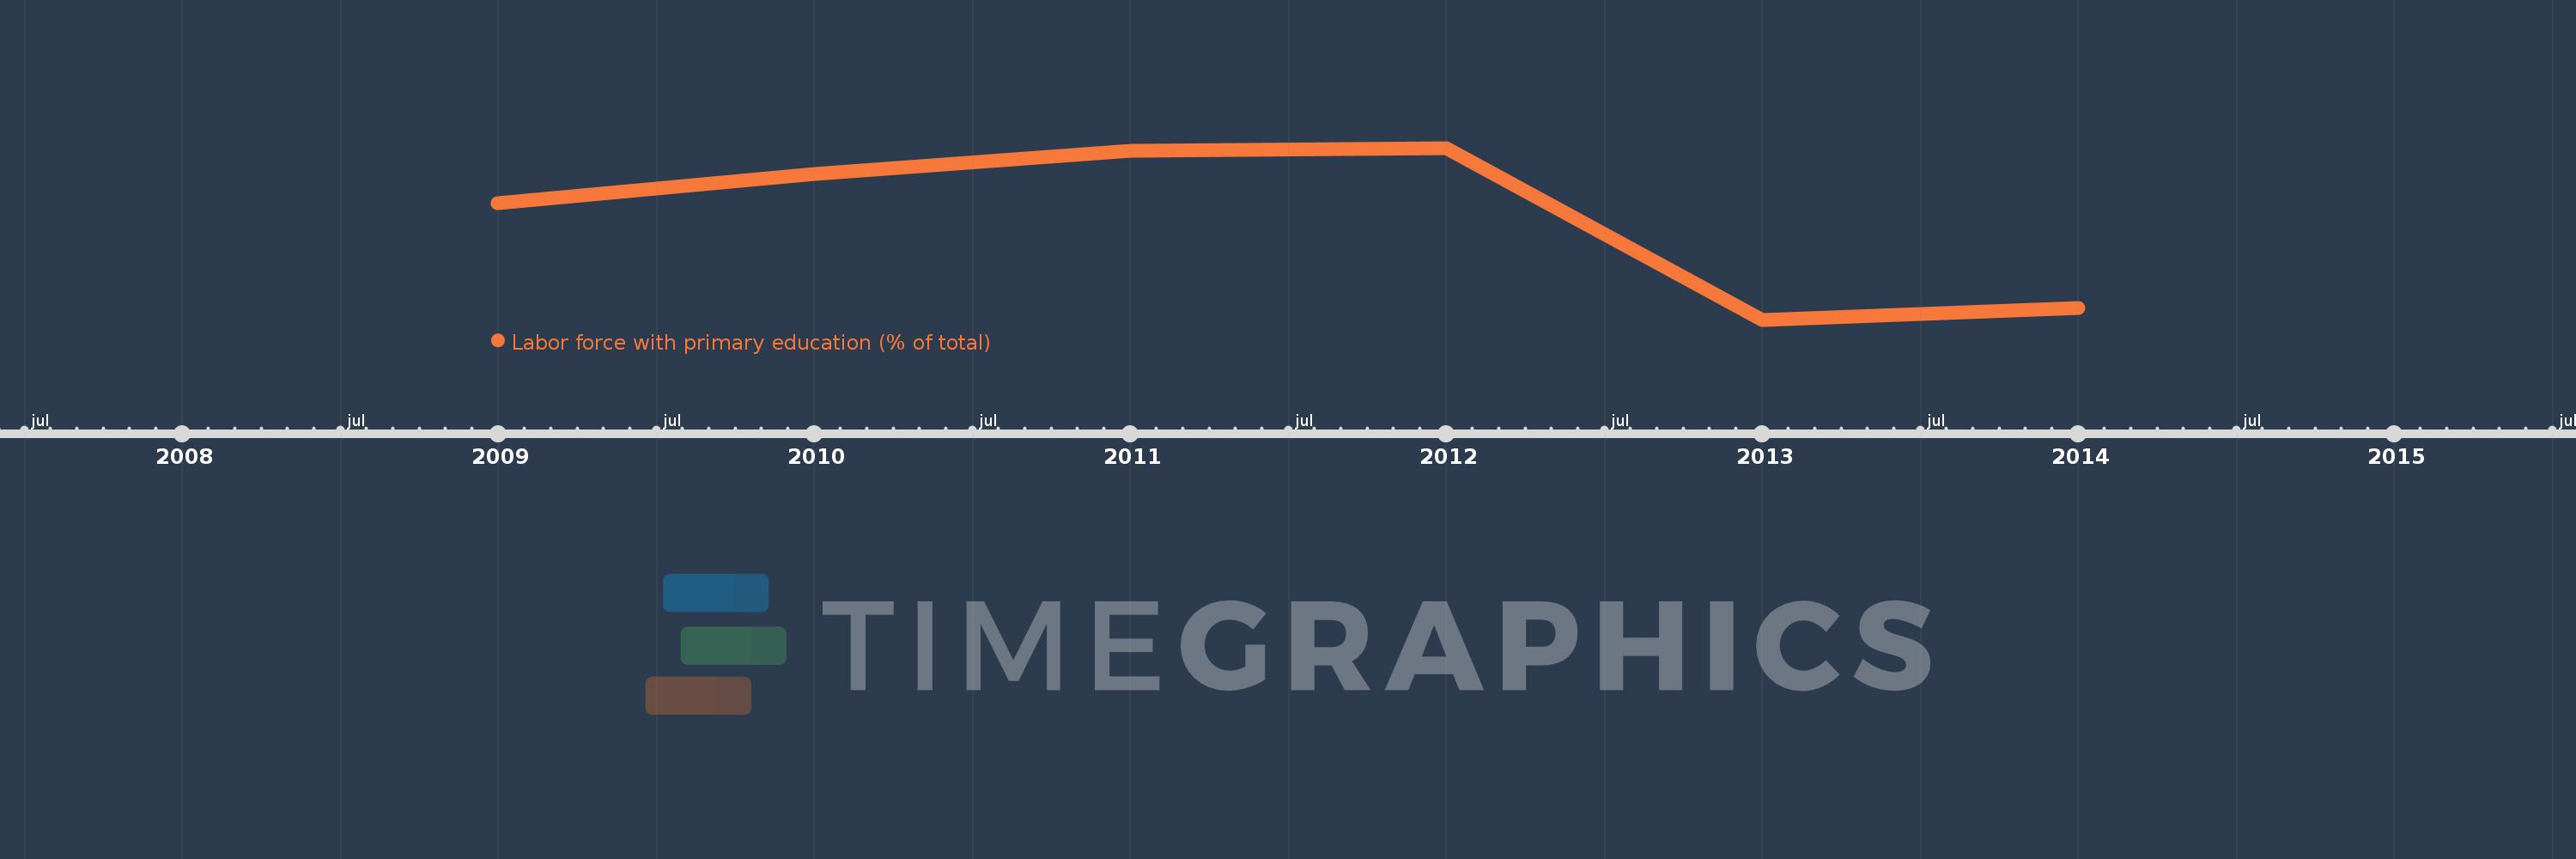
Questa scala temporale mostra un grafico dal 2009 anno al 2014 anno. Egypt, Arab Rep.. I dati fino ad 2008 anno non disponibili. Il numero di osservazioni attuali secondo i date: 6.
La fonte (nome):
Indicatori dello sviluppo mondiale
La fonte (organizzazione):
International Labour Organization, Key Indicators of the Labour Market database.
Categorie:
Education, Social Protection & Labor
sono stati aggiornati
23 apr 2017 anni
Indicatori delle variazioni dei valori per anni
In media:
8.017
Minima:
4.5
1 gen 2013 anni
Massimo:
10.4
1 gen 2012 anni
Alla data di osservazione
Valore
Variazione assoluta
La variazione rispetto al valore precedente
1 gen 2009 anni
8.5
+8.5
0.0%
1 gen 2010 anni
9.5
+1.0
11.76%
1 gen 2011 anni
10.3
+0.8
8.42%
1 gen 2012 anni
10.4
+0.1
0.97%
1 gen 2013 anni
4.5
-5.9
-56.73%
1 gen 2014 anni
4.9
+0.4
8.89%
Classificazione dei paesi secondo i statistiche attuali per anni