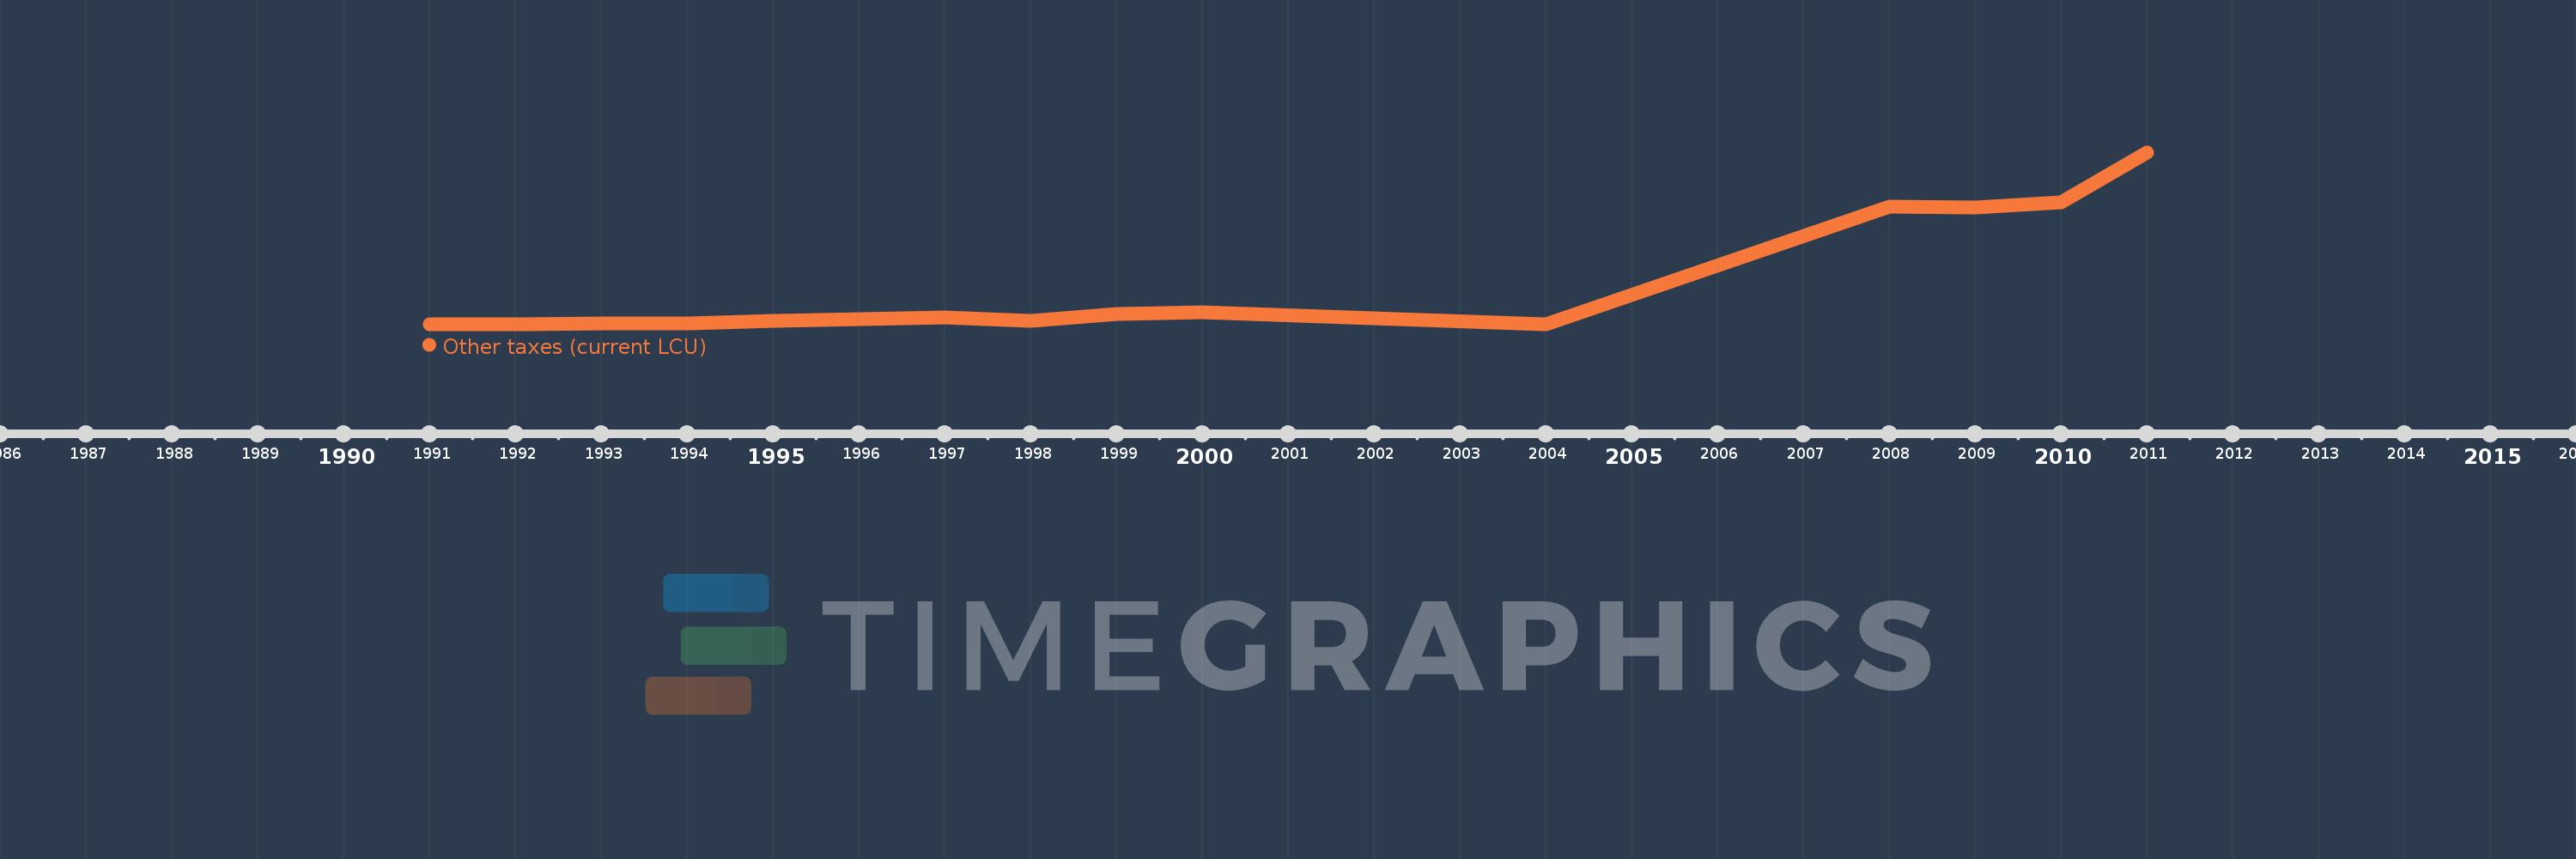
Questa scala temporale mostra un grafico dal 1991 anno al 2011 anno. Zambia. I dati fino ad 1990 anno non disponibili. Il numero di osservazioni attuali secondo i date: 15.
La fonte (nome):
Indicatori dello sviluppo mondiale
La fonte (organizzazione):
International Monetary Fund, Government Finance Statistics Yearbook and data files.
Categorie:
Public Sector
sono stati aggiornati
23 apr 2017 anni
Indicatori delle variazioni dei valori per anni
In media:
7.528 Mln
Minima:
1.092 Mille.
1 gen 2004 anni
Massimo:
34.02 Mln
1 gen 2011 anni
Alla data di osservazione
Valore
Variazione assoluta
La variazione rispetto al valore precedente
1 gen 1991 anni
25.1 Mille.
+25.1 Mille.
0.0%
1 gen 1992 anni
67.1 Mille.
+42.0 Mille.
167.33%
1 gen 1993 anni
136.9 Mille.
+69.8 Mille.
104.02%
1 gen 1994 anni
134.6 Mille.
-2.3 Mille.
-1.68%
1 gen 1995 anni
633.2 Mille.
+498.6 Mille.
370.43%
1 gen 1996 anni
935.4 Mille.
+302.2 Mille.
47.73%
1 gen 1997 anni
1.4 Mln
+465.0 Mille.
49.71%
1 gen 1998 anni
600.0 Mille.
-800.4 Mille.
-57.16%
1 gen 1999 anni
2.1 Mln
+1.5 Mln
250.0%
1 gen 2000 anni
2.3 Mln
+200.0 Mille.
9.52%
1 gen 2004 anni
1.092 Mille.
-2.299 Mln
-99.95%
1 gen 2008 anni
23.347 Mln
+23.346 Mln
2.14 Mln%
1 gen 2009 anni
23.125 Mln
-222.026 Mille.
-0.95%
1 gen 2010 anni
24.1 Mln
+975.457 Mille.
4.22%
1 gen 2011 anni
34.02 Mln
+9.92 Mln
41.16%
Classificazione dei paesi secondo i statistiche attuali per anni