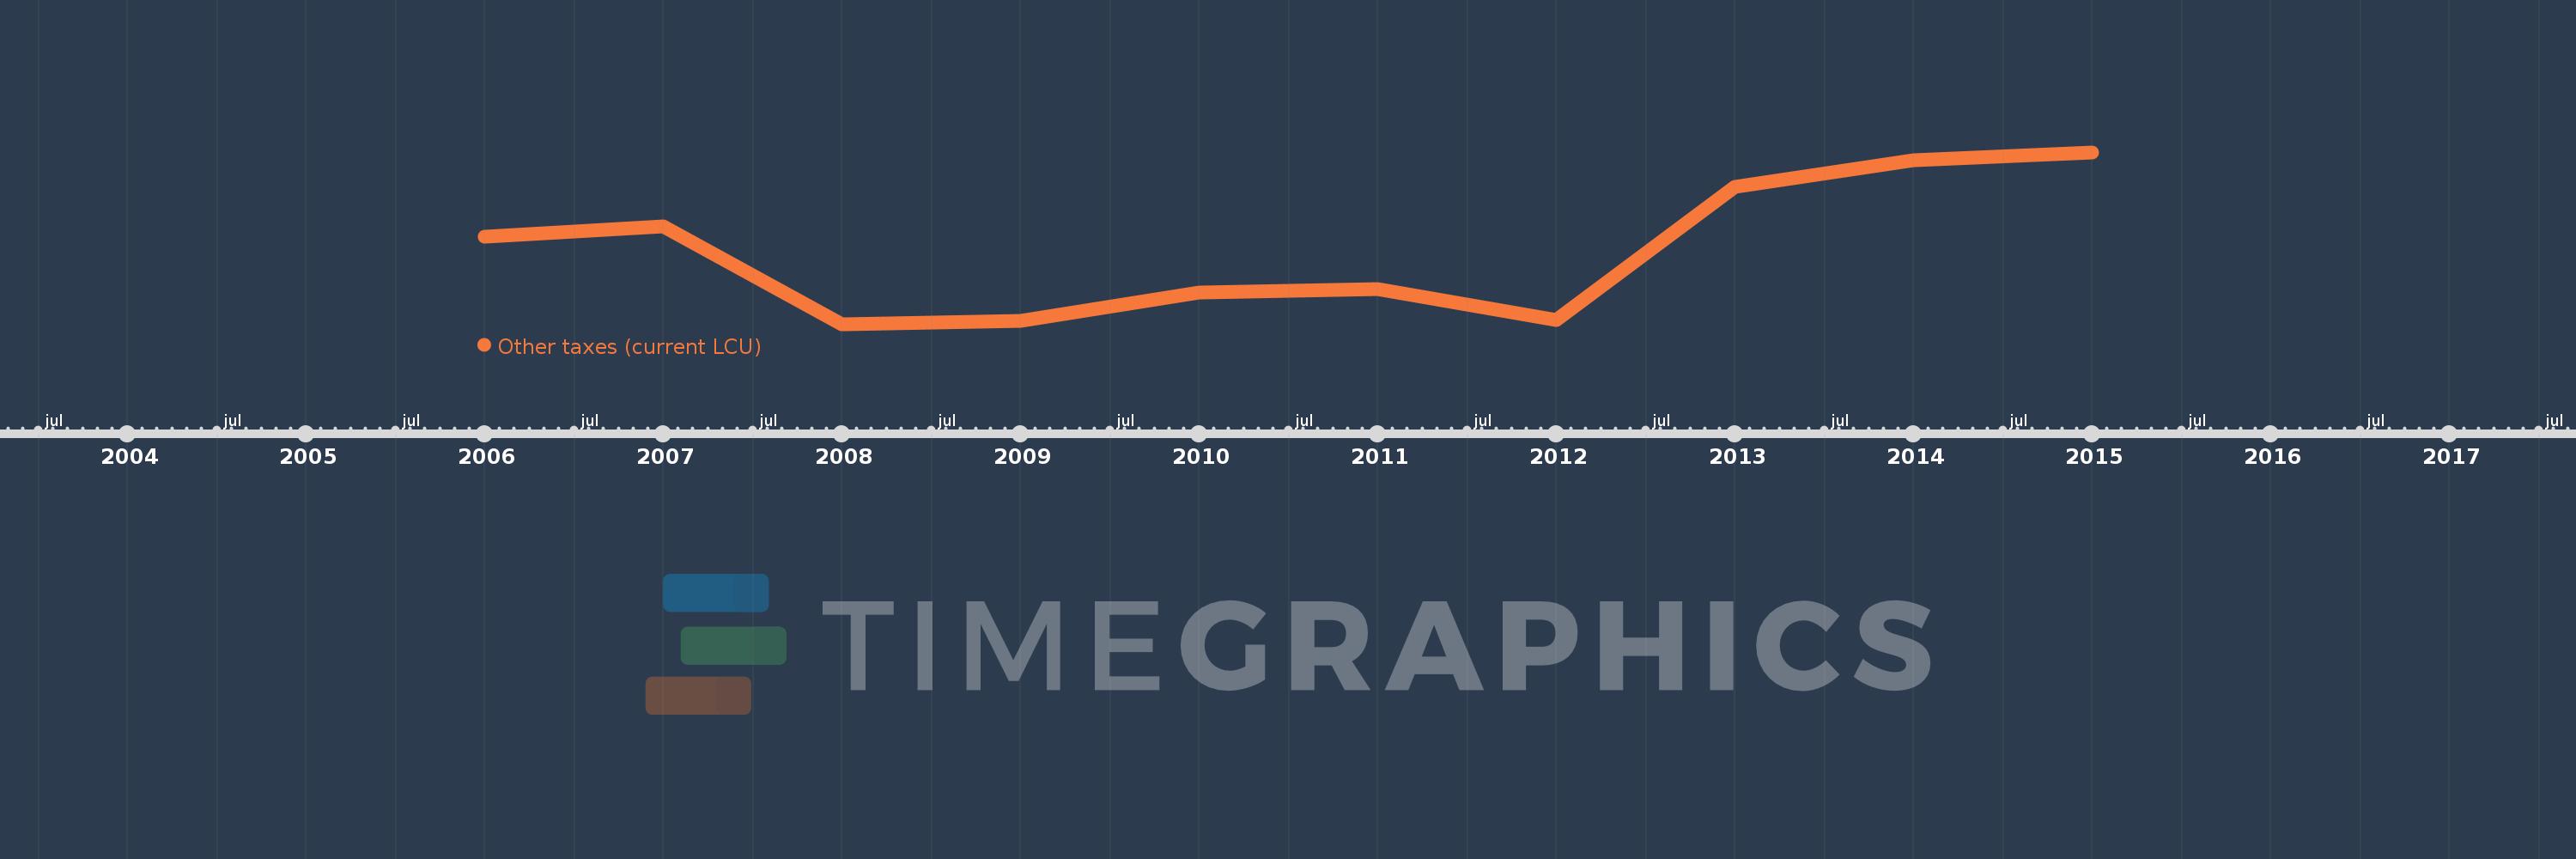
Questa scala temporale mostra un grafico dal 2006 anno al 2015 anno. West Bank and Gaza. I dati fino ad 2005 anno non disponibili. Il numero di osservazioni attuali secondo i date: 10.
La fonte (nome):
Indicatori dello sviluppo mondiale
La fonte (organizzazione):
International Monetary Fund, Government Finance Statistics Yearbook and data files.
Categorie:
Public Sector
sono stati aggiornati
23 apr 2017 anni
Indicatori delle variazioni dei valori per anni
In media:
29.993 Mln
Minima:
1000.0 Mille.
1 gen 2008 anni
Massimo:
68.984 Mln
1 gen 2015 anni
Alla data di osservazione
Valore
Variazione assoluta
La variazione rispetto al valore precedente
1 gen 2006 anni
35.743 Mln
+35.743 Mln
0.0%
1 gen 2007 anni
39.59 Mln
+3.847 Mln
10.76%
1 gen 2008 anni
1000.0 Mille.
-38.59 Mln
-97.47%
1 gen 2009 anni
2.21 Mln
+1.21 Mln
121.02%
1 gen 2010 anni
13.407 Mln
+11.197 Mln
506.6%
1 gen 2011 anni
14.957 Mln
+1.55 Mln
11.56%
1 gen 2012 anni
2.818 Mln
-12.139 Mln
-81.16%
1 gen 2013 anni
55.291 Mln
+52.473 Mln
1.86 Mille.%
1 gen 2014 anni
65.93 Mln
+10.639 Mln
19.24%
1 gen 2015 anni
68.984 Mln
+3.054 Mln
4.63%
Classificazione dei paesi secondo i statistiche attuali per anni