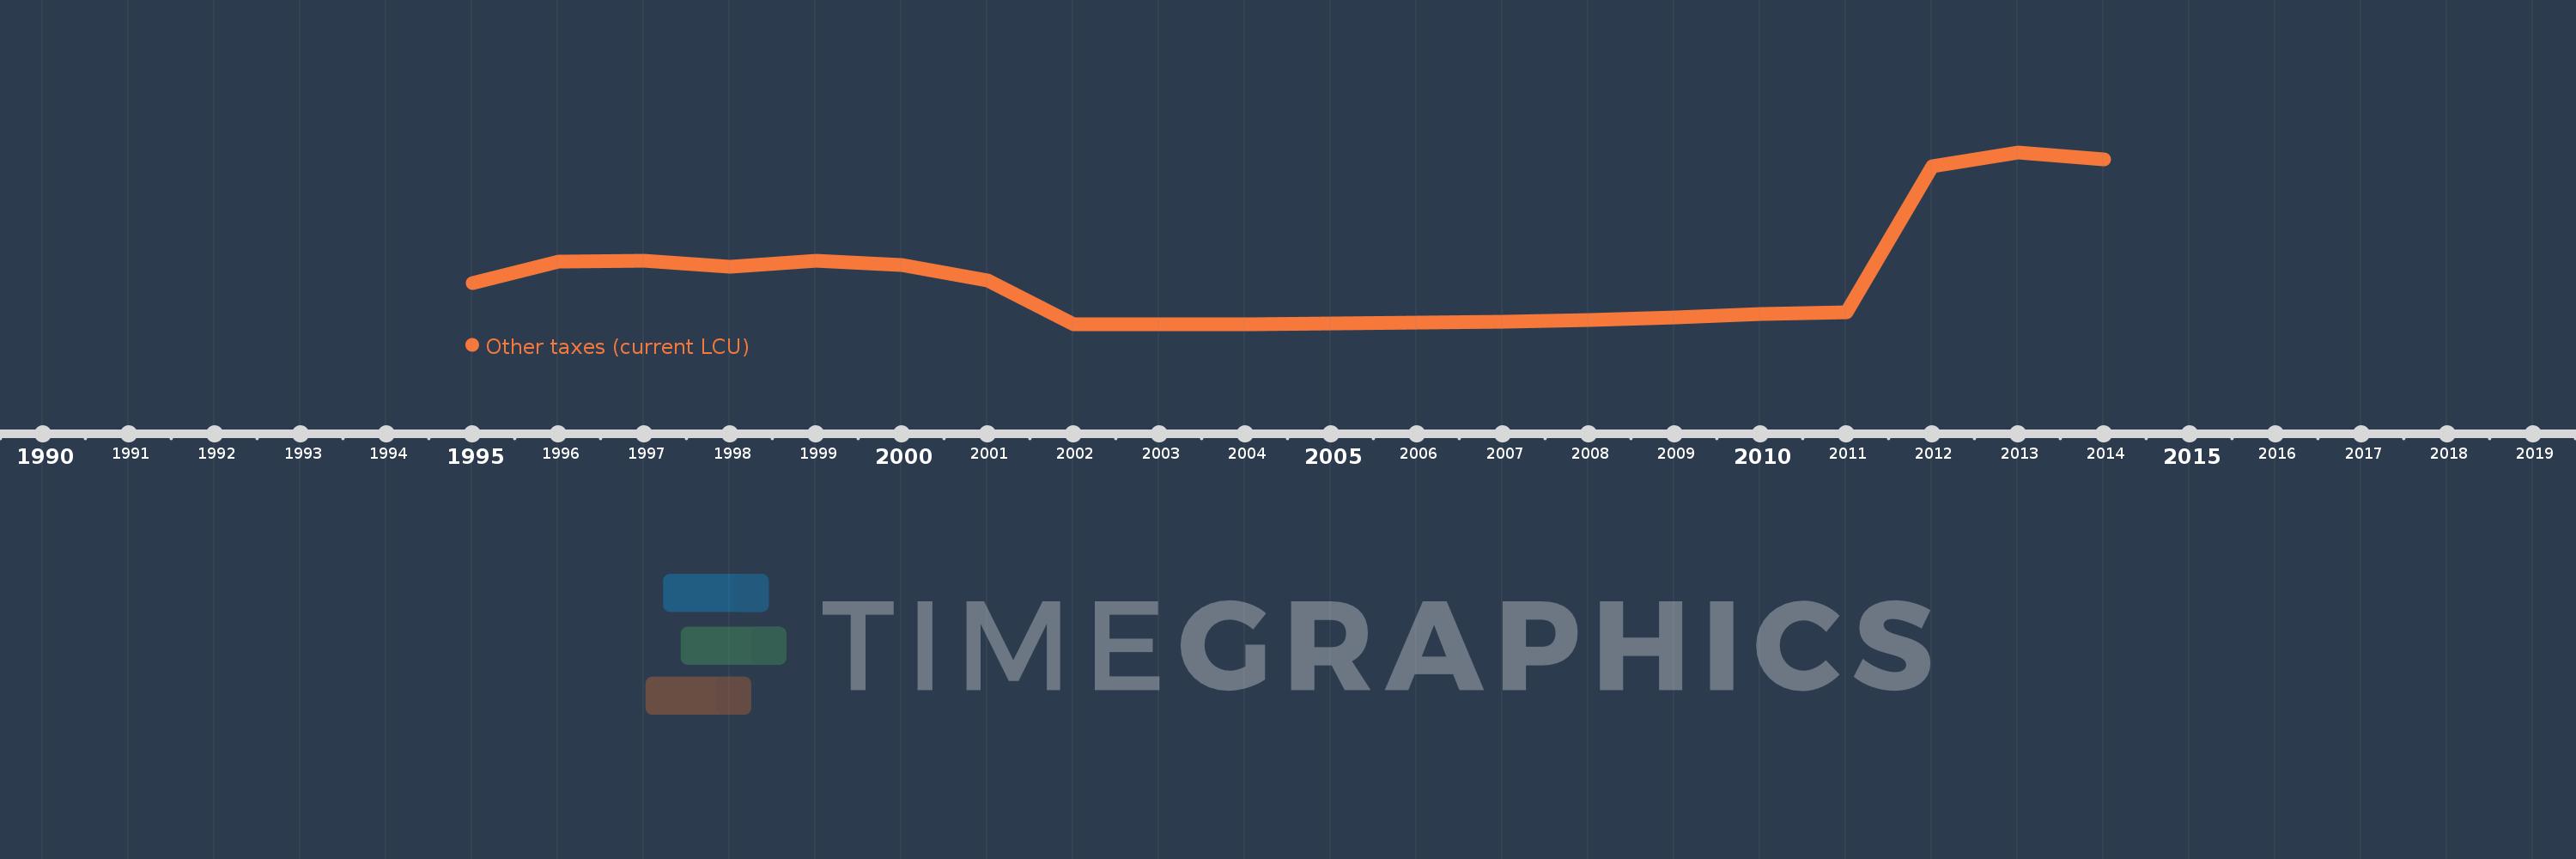
Questa scala temporale mostra un grafico dal 1995 anno al 2014 anno. Vietnam. I dati fino ad 1994 anno non disponibili. Il numero di osservazioni attuali secondo i date: 20.
La fonte (nome):
Indicatori dello sviluppo mondiale
La fonte (organizzazione):
International Monetary Fund, Government Finance Statistics Yearbook and data files.
Categorie:
Public Sector
sono stati aggiornati
23 apr 2017 anni
Indicatori delle variazioni dei valori per anni
In media:
4.108 Trln
Minima:
488.0 Mlrd
1 gen 2002 anni
Massimo:
13.938 Trln
1 gen 2013 anni
Alla data di osservazione
Valore
Variazione assoluta
La variazione rispetto al valore precedente
1 gen 1995 anni
3.74 Trln
+3.74 Trln
0.0%
1 gen 1996 anni
5.399 Trln
+1.659 Trln
44.36%
1 gen 1997 anni
5.447 Trln
+48.0 Mlrd
0.89%
1 gen 1998 anni
4.965 Trln
-482.0 Mlrd
-8.85%
1 gen 1999 anni
5.435 Trln
+470.0 Mlrd
9.47%
1 gen 2000 anni
5.093 Trln
-342.0 Mlrd
-6.29%
1 gen 2001 anni
3.942 Trln
-1.151 Trln
-22.6%
1 gen 2002 anni
488.0 Mlrd
-3.454 Trln
-87.62%
1 gen 2003 anni
506.0 Mlrd
+18.0 Mlrd
3.69%
1 gen 2004 anni
510.0 Mlrd
+4.0 Mlrd
0.79%
1 gen 2005 anni
568.0 Mlrd
+58.0 Mlrd
11.37%
1 gen 2006 anni
647.0 Mlrd
+79.0 Mlrd
13.91%
1 gen 2007 anni
705.0 Mlrd
+58.0 Mlrd
8.96%
1 gen 2008 anni
824.0 Mlrd
+119.0 Mlrd
16.88%
1 gen 2009 anni
999.0 Mlrd
+175.0 Mlrd
21.24%
1 gen 2010 anni
1.27 Trln
+271.0 Mlrd
27.13%
1 gen 2011 anni
1.452 Trln
+182.0 Mlrd
14.33%
1 gen 2012 anni
12.862 Trln
+11.41 Trln
785.81%
1 gen 2013 anni
13.938 Trln
+1.076 Trln
8.37%
1 gen 2014 anni
13.365 Trln
-573.0 Mlrd
-4.11%
Classificazione dei paesi secondo i statistiche attuali per anni