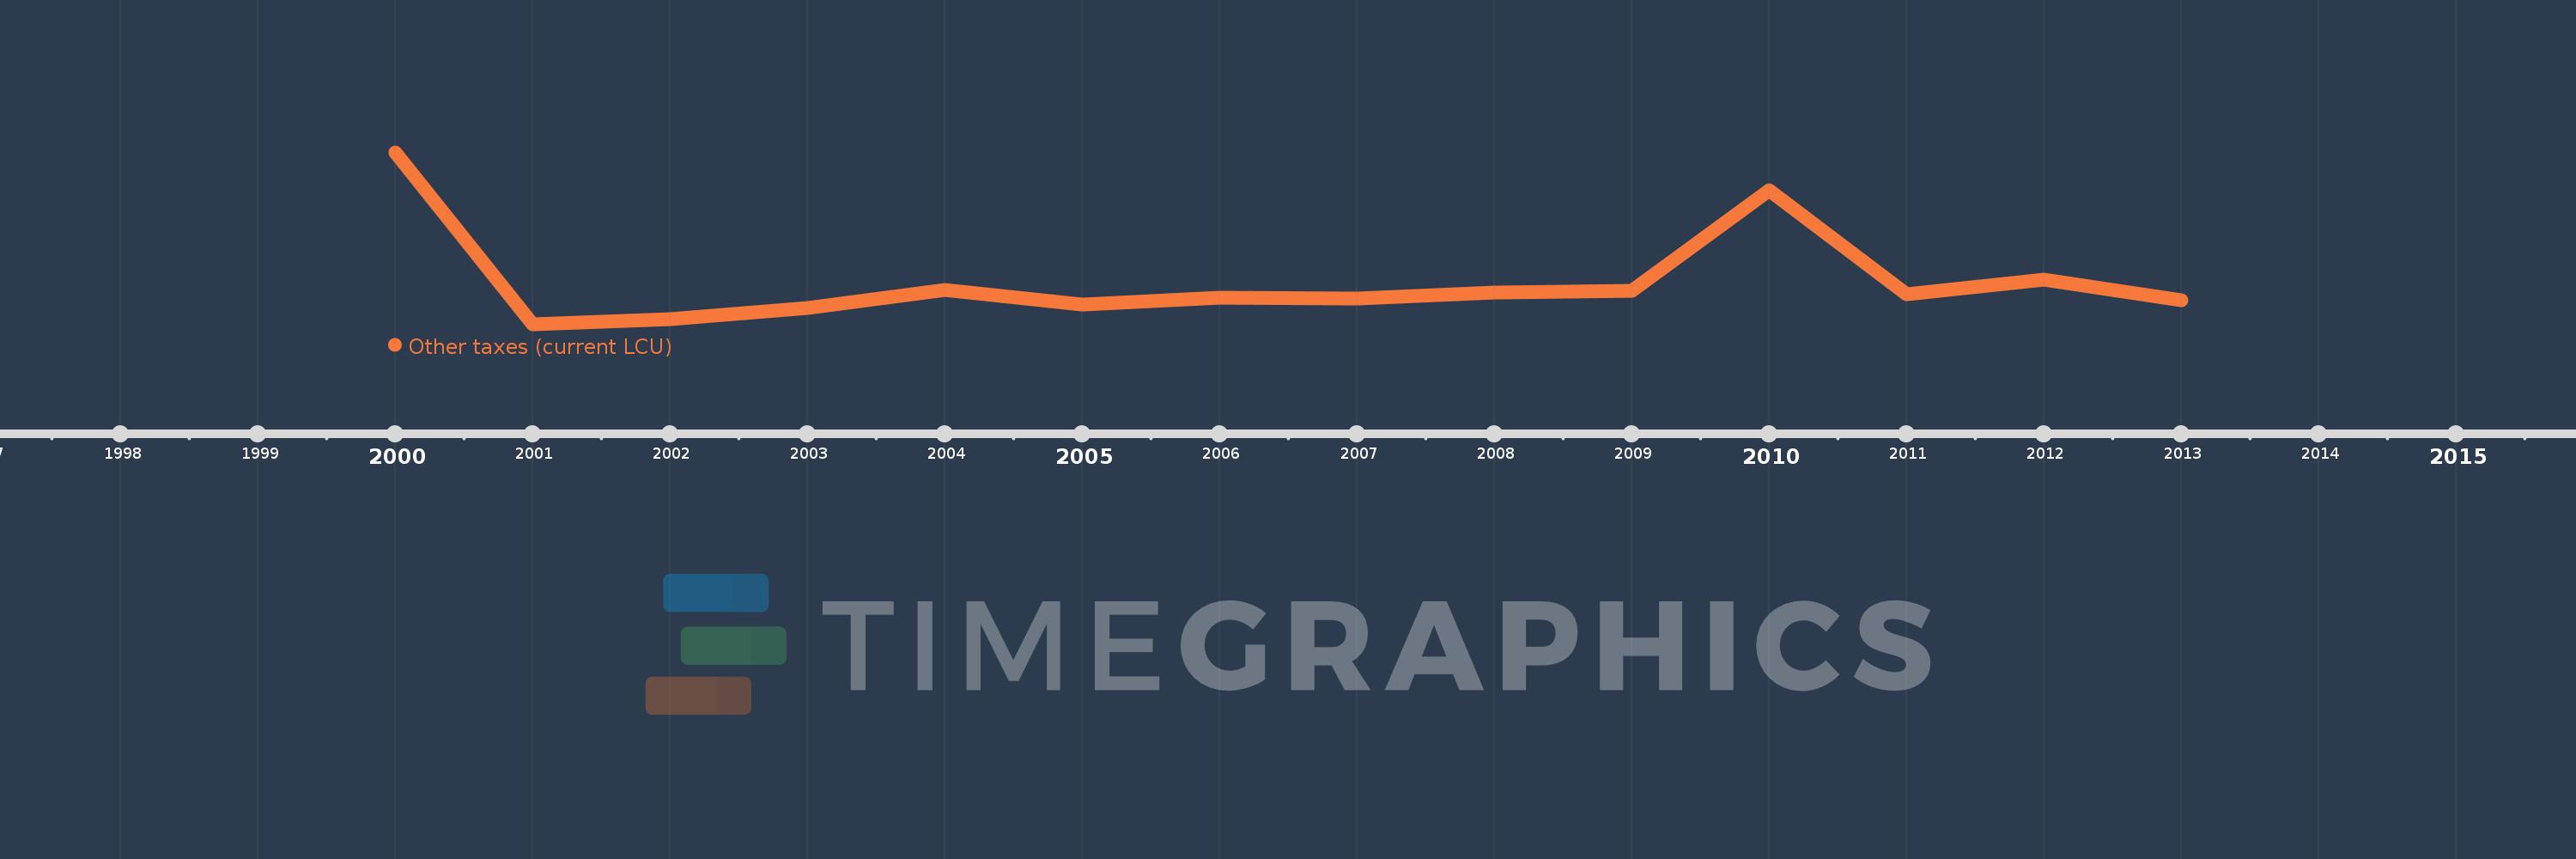
Questa scala temporale mostra un grafico dal 2000 anno al 2013 anno. Swaziland. I dati fino ad 1999 anno non disponibili. Il numero di osservazioni attuali secondo i date: 14.
La fonte (nome):
Indicatori dello sviluppo mondiale
La fonte (organizzazione):
International Monetary Fund, Government Finance Statistics Yearbook and data files.
Categorie:
Public Sector
sono stati aggiornati
23 apr 2017 anni
Indicatori delle variazioni dei valori per anni
In media:
35.518 Mln
Minima:
9.843 Mln
1 gen 2001 anni
Massimo:
113.3 Mln
1 gen 2000 anni
Alla data di osservazione
Valore
Variazione assoluta
La variazione rispetto al valore precedente
1 gen 2000 anni
113.3 Mln
+113.3 Mln
0.0%
1 gen 2001 anni
9.843 Mln
-103.457 Mln
-91.31%
1 gen 2002 anni
13.025 Mln
+3.182 Mln
32.33%
1 gen 2003 anni
19.846 Mln
+6.821 Mln
52.37%
1 gen 2004 anni
30.737 Mln
+10.891 Mln
54.88%
1 gen 2005 anni
21.62 Mln
-9.117 Mln
-29.66%
1 gen 2006 anni
25.594 Mln
+3.974 Mln
18.38%
1 gen 2007 anni
25.131 Mln
-463.105 Mille.
-1.81%
1 gen 2008 anni
28.877 Mln
+3.746 Mln
14.91%
1 gen 2009 anni
29.739 Mln
+862.0 Mille.
2.99%
1 gen 2010 anni
90.69 Mln
+60.951 Mln
204.95%
1 gen 2011 anni
27.691 Mln
-62.999 Mln
-69.47%
1 gen 2012 anni
36.749 Mln
+9.058 Mln
32.71%
1 gen 2013 anni
24.407 Mln
-12.342 Mln
-33.58%
Classificazione dei paesi secondo i statistiche attuali per anni