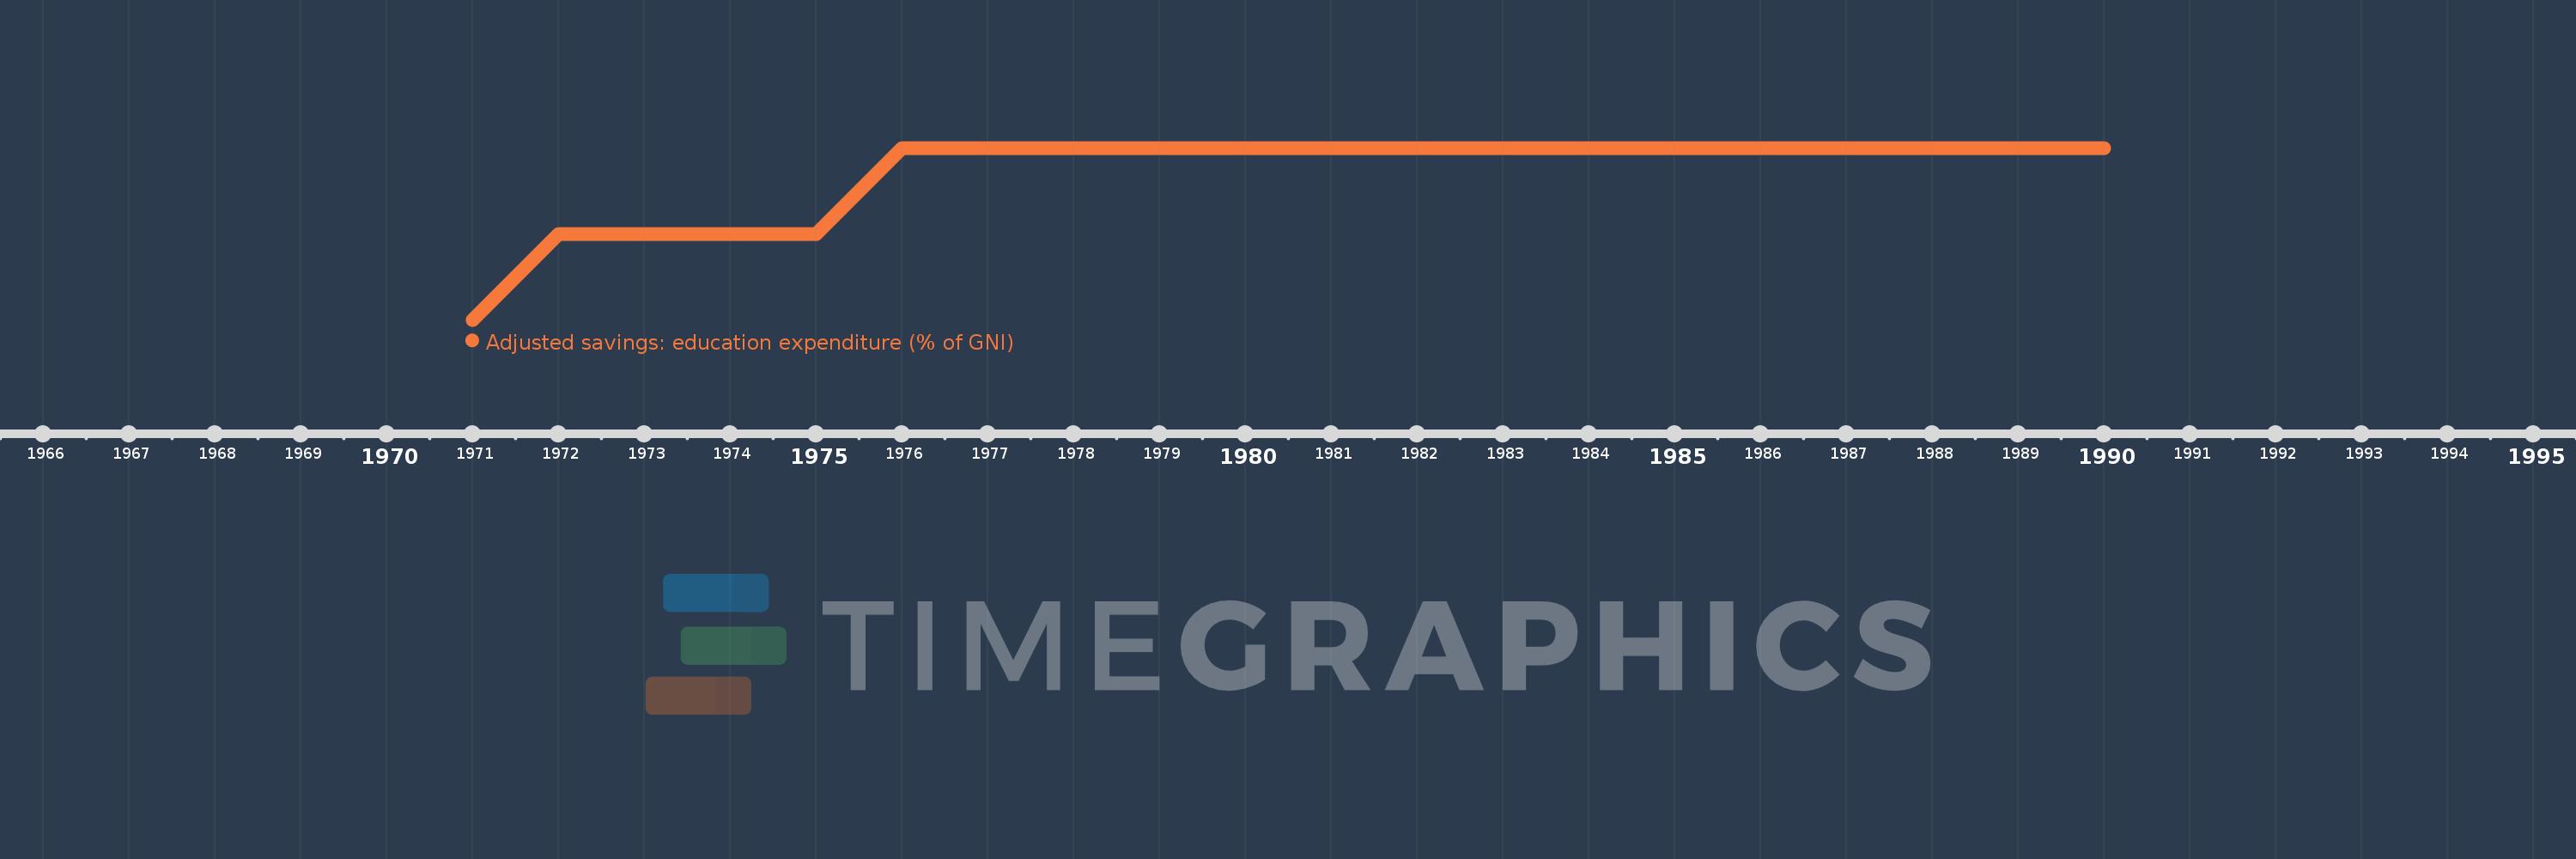
Questa scala temporale mostra un grafico dal 1971 anno al 1990 anno. Virgin Islands (U.S.). I dati fino ad 1970 anno non disponibili. Il numero di osservazioni attuali secondo i date: 20.
La fonte (nome):
Indicatori dello sviluppo mondiale
La fonte (organizzazione):
World Bank staff estimates using data from the United Nations Statistics Division's Statistical Yearbook, and the UNESCO Institute for Statistics online database.
Categorie:
Economy & Growth, Environment
sono stati aggiornati
23 apr 2017 anni
Indicatori delle variazioni dei valori per anni
In media:
8.913
Minima:
6.4
1 gen 1971 anni
Massimo:
9.356
1 gen 1976 anni
Alla data di osservazione
Valore
Variazione assoluta
La variazione rispetto al valore precedente
1 gen 1971 anni
6.4
+6.4
0.0%
1 gen 1972 anni
7.878
+1.478
23.09%
1 gen 1973 anni
7.878
0.0
0.0%
1 gen 1974 anni
7.878
0.0
0.0%
1 gen 1975 anni
7.878
0.0
0.0%
1 gen 1976 anni
9.356
+1.478
18.76%
1 gen 1977 anni
9.356
0.0
0.0%
1 gen 1978 anni
9.356
0.0
0.0%
1 gen 1979 anni
9.356
0.0
0.0%
1 gen 1980 anni
9.356
0.0
0.0%
1 gen 1981 anni
9.356
0.0
0.0%
1 gen 1982 anni
9.356
0.0
0.0%
1 gen 1983 anni
9.356
0.0
0.0%
1 gen 1984 anni
9.356
0.0
0.0%
1 gen 1985 anni
9.356
0.0
0.0%
1 gen 1986 anni
9.356
0.0
0.0%
1 gen 1987 anni
9.356
0.0
0.0%
1 gen 1988 anni
9.356
0.0
0.0%
1 gen 1989 anni
9.356
0.0
0.0%
1 gen 1990 anni
9.356
0.0
0.0%
Classificazione dei paesi secondo i statistiche attuali per anni