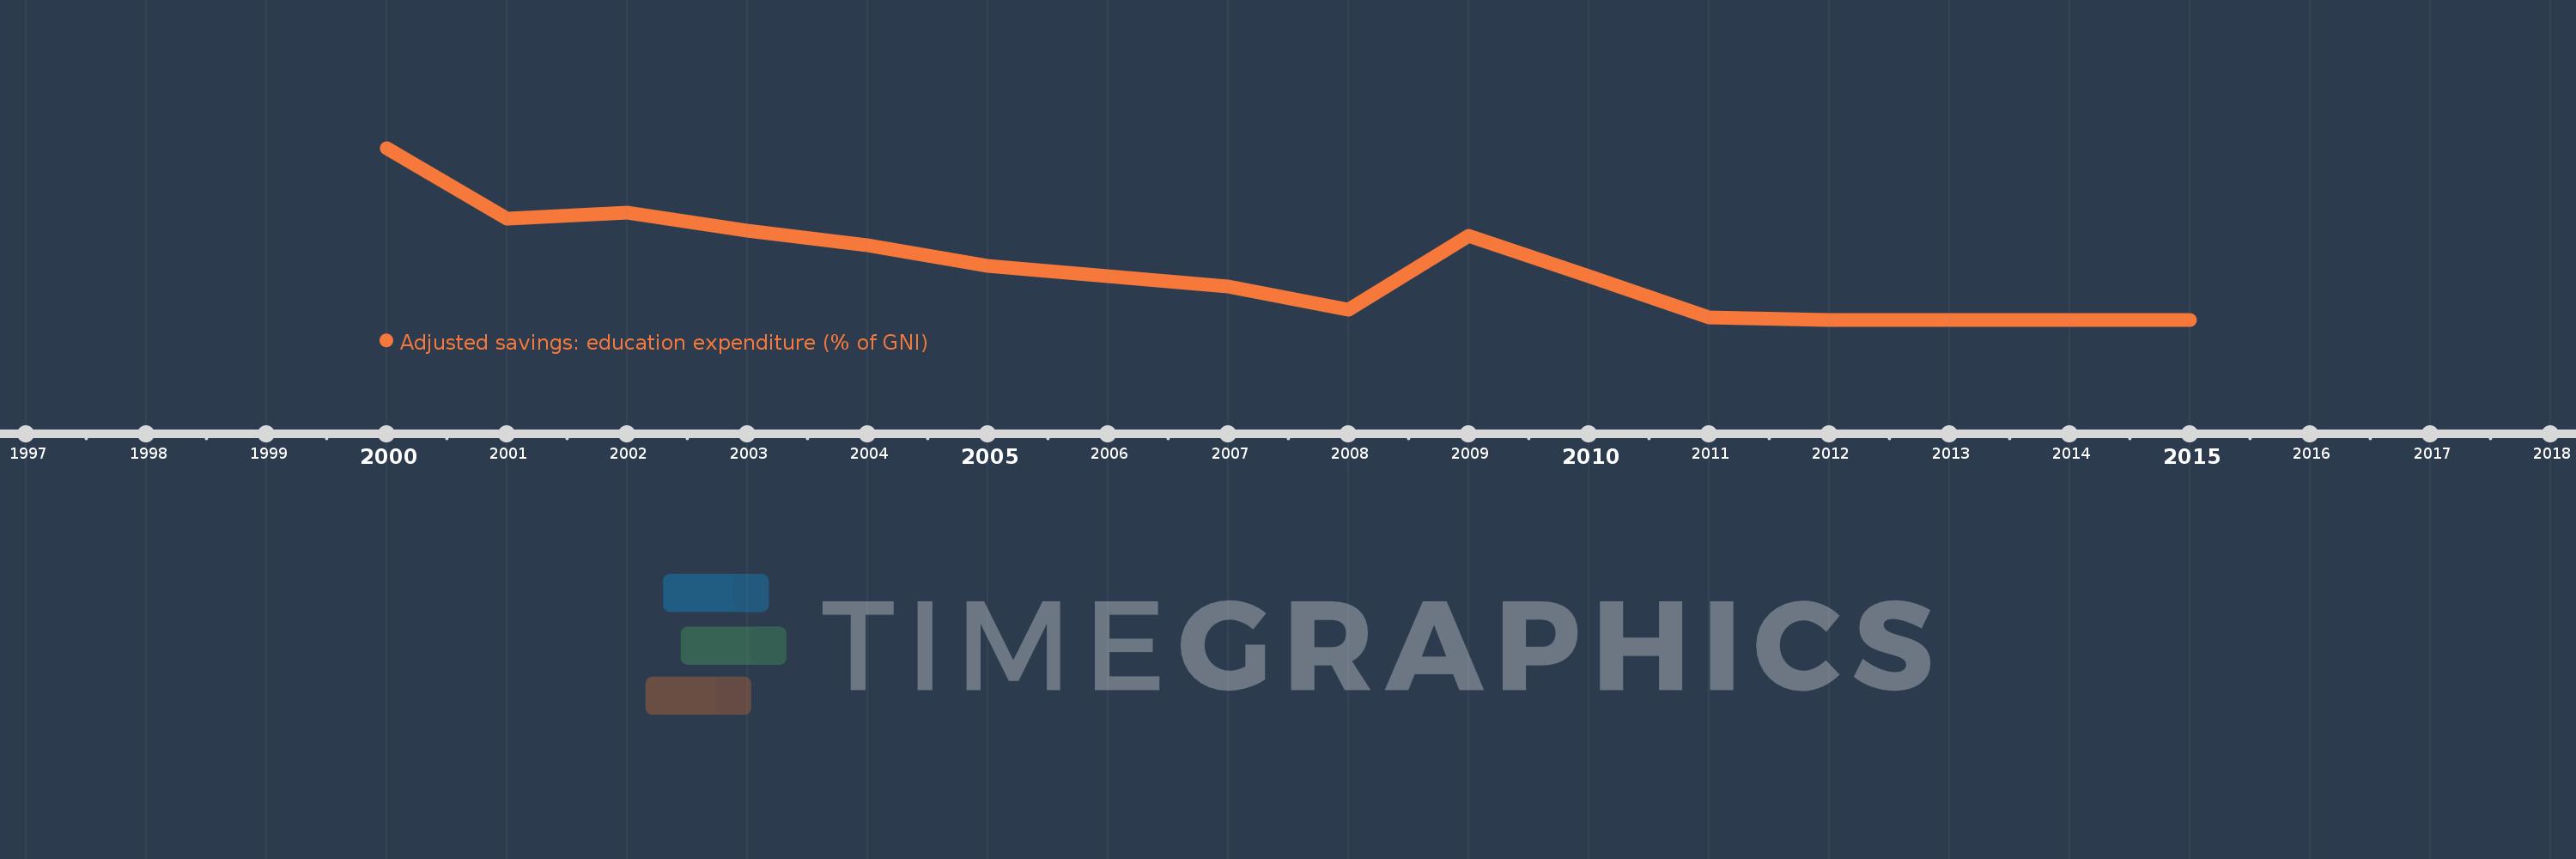
Questa scala temporale mostra un grafico dal 2000 anno al 2015 anno. Latvia. I dati fino ad 1999 anno non disponibili. Il numero di osservazioni attuali secondo i date: 16.
La fonte (nome):
Indicatori dello sviluppo mondiale
La fonte (organizzazione):
World Bank staff estimates using data from the United Nations Statistics Division's Statistical Yearbook, and the UNESCO Institute for Statistics online database.
Categorie:
Economy & Growth, Environment
sono stati aggiornati
23 apr 2017 anni
Indicatori delle variazioni dei valori per anni
In media:
4.691
Minima:
4.329
1 gen 2012 anni
Massimo:
5.552
1 gen 2000 anni
Alla data di osservazione
Valore
Variazione assoluta
La variazione rispetto al valore precedente
1 gen 2000 anni
5.552
+5.552
0.0%
1 gen 2001 anni
5.05
-0.501
-9.03%
1 gen 2002 anni
5.09
+0.04
0.79%
1 gen 2003 anni
4.962
-0.128
-2.52%
1 gen 2004 anni
4.86
-0.102
-2.06%
1 gen 2005 anni
4.713
-0.147
-3.02%
1 gen 2006 anni
4.638
-0.075
-1.59%
1 gen 2007 anni
4.563
-0.075
-1.62%
1 gen 2008 anni
4.401
-0.162
-3.55%
1 gen 2009 anni
4.926
+0.525
11.92%
1 gen 2010 anni
4.636
-0.289
-5.88%
1 gen 2011 anni
4.346
-0.29
-6.26%
1 gen 2012 anni
4.329
-0.017
-0.39%
1 gen 2013 anni
4.329
0.0
0.0%
1 gen 2014 anni
4.329
0.0
0.0%
1 gen 2015 anni
4.329
0.0
0.0%
Classificazione dei paesi secondo i statistiche attuali per anni