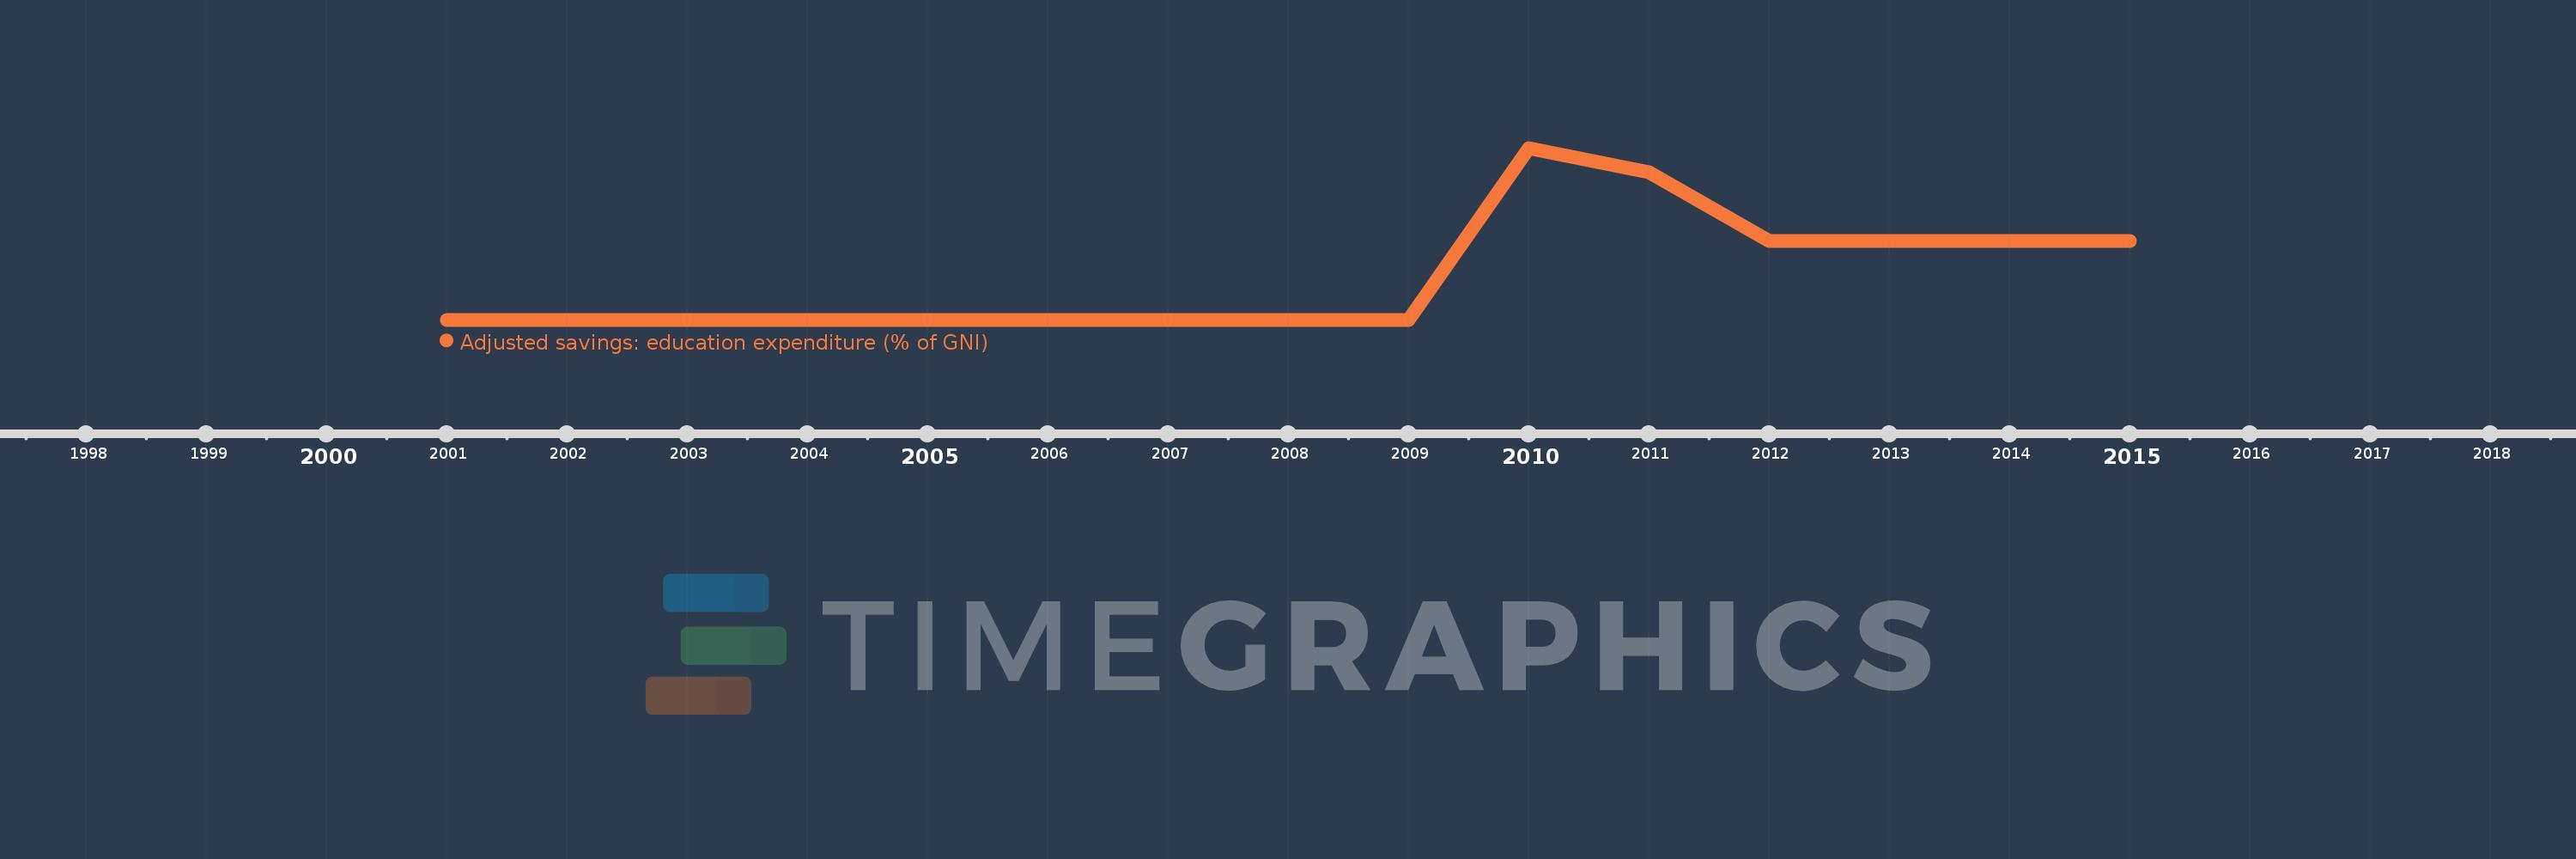
Questa scala temporale mostra un grafico dal 2001 anno al 2015 anno. Timor-Leste. I dati fino ad 2000 anno non disponibili. Il numero di osservazioni attuali secondo i date: 15.
La fonte (nome):
Indicatori dello sviluppo mondiale
La fonte (organizzazione):
World Bank staff estimates using data from the United Nations Statistics Division's Statistical Yearbook, and the UNESCO Institute for Statistics online database.
Categorie:
Economy & Growth, Environment
sono stati aggiornati
23 apr 2017 anni
Indicatori delle variazioni dei valori per anni
In media:
1.816
Minima:
1.46
1 gen 2001 anni
Massimo:
2.904
1 gen 2010 anni
Alla data di osservazione
Valore
Variazione assoluta
La variazione rispetto al valore precedente
1 gen 2001 anni
1.46
+1.46
0.0%
1 gen 2002 anni
1.46
0.0
0.0%
1 gen 2003 anni
1.46
0.0
0.0%
1 gen 2004 anni
1.46
0.0
0.0%
1 gen 2005 anni
1.46
0.0
0.0%
1 gen 2006 anni
1.46
0.0
0.0%
1 gen 2007 anni
1.46
0.0
0.0%
1 gen 2008 anni
1.46
0.0
0.0%
1 gen 2009 anni
1.46
0.0
0.0%
1 gen 2010 anni
2.904
+1.444
98.94%
1 gen 2011 anni
2.7
-0.204
-7.04%
1 gen 2012 anni
2.122
-0.578
-21.4%
1 gen 2013 anni
2.122
0.0
0.0%
1 gen 2014 anni
2.122
0.0
0.0%
1 gen 2015 anni
2.122
0.0
0.0%
Classificazione dei paesi secondo i statistiche attuali per anni