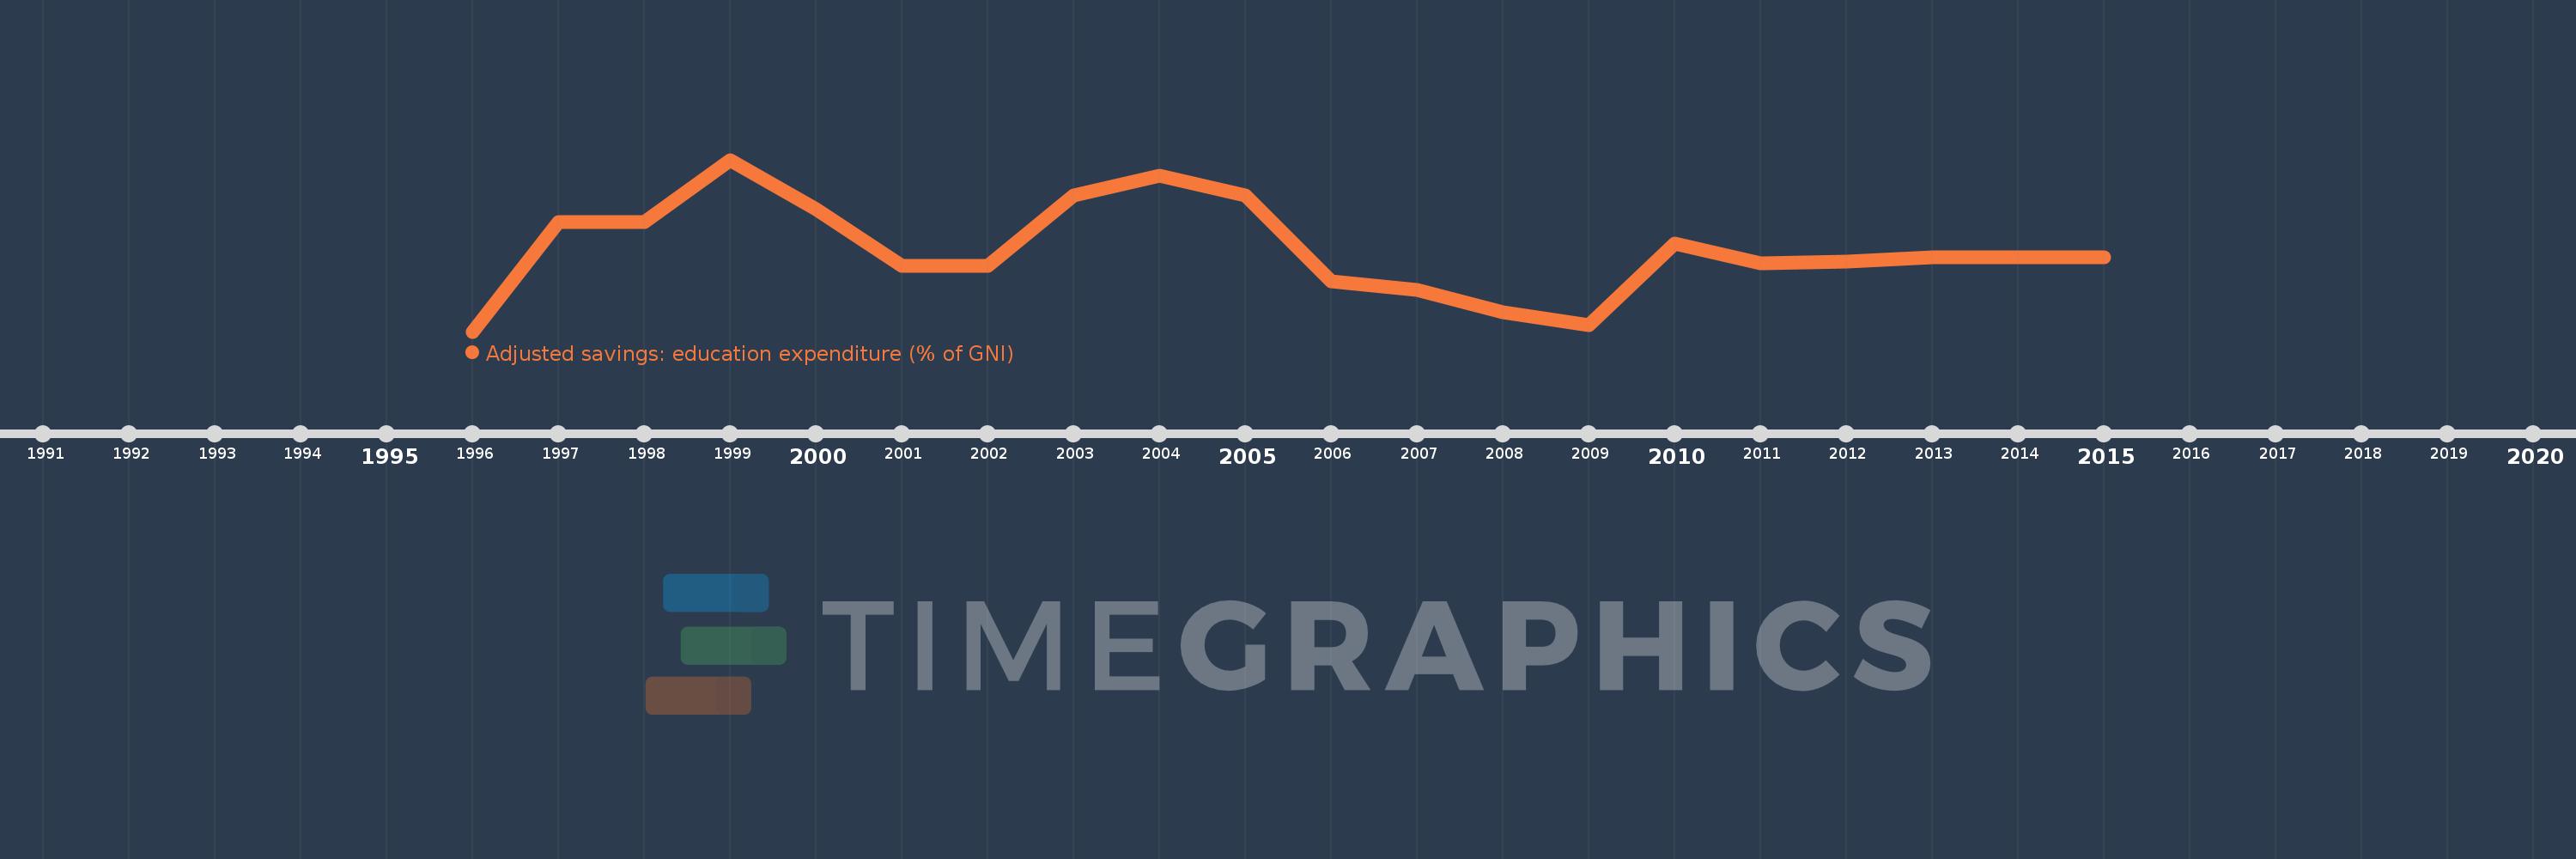
Questa scala temporale mostra un grafico dal 1996 anno al 2015 anno. Slovak Republic. I dati fino ad 1995 anno non disponibili. Il numero di osservazioni attuali secondo i date: 20.
La fonte (nome):
Indicatori dello sviluppo mondiale
La fonte (organizzazione):
World Bank staff estimates using data from the United Nations Statistics Division's Statistical Yearbook, and the UNESCO Institute for Statistics online database.
Categorie:
Economy & Growth, Environment
sono stati aggiornati
23 apr 2017 anni
Indicatori delle variazioni dei valori per anni
In media:
3.774
Minima:
3.4
1 gen 1996 anni
Massimo:
4.184
1 gen 1999 anni
Alla data di osservazione
Valore
Variazione assoluta
La variazione rispetto al valore precedente
1 gen 1996 anni
3.4
+3.4
0.0%
1 gen 1997 anni
3.9
+0.5
14.71%
1 gen 1998 anni
3.9
0.0
0.0%
1 gen 1999 anni
4.184
+0.284
7.28%
1 gen 2000 anni
3.96
-0.224
-5.35%
1 gen 2001 anni
3.7
-0.26
-6.57%
1 gen 2002 anni
3.7
0.0
0.0%
1 gen 2003 anni
4.02
+0.32
8.65%
1 gen 2004 anni
4.11
+0.09
2.24%
1 gen 2005 anni
4.02
-0.09
-2.19%
1 gen 2006 anni
3.63
-0.39
-9.7%
1 gen 2007 anni
3.59
-0.04
-1.1%
1 gen 2008 anni
3.49
-0.1
-2.79%
1 gen 2009 anni
3.43
-0.06
-1.72%
1 gen 2010 anni
3.8
+0.37
10.79%
1 gen 2011 anni
3.71
-0.09
-2.37%
1 gen 2012 anni
3.72
+0.01
0.27%
1 gen 2013 anni
3.74
+0.02
0.54%
1 gen 2014 anni
3.74
0.0
0.0%
1 gen 2015 anni
3.74
0.0
0.0%
Classificazione dei paesi secondo i statistiche attuali per anni