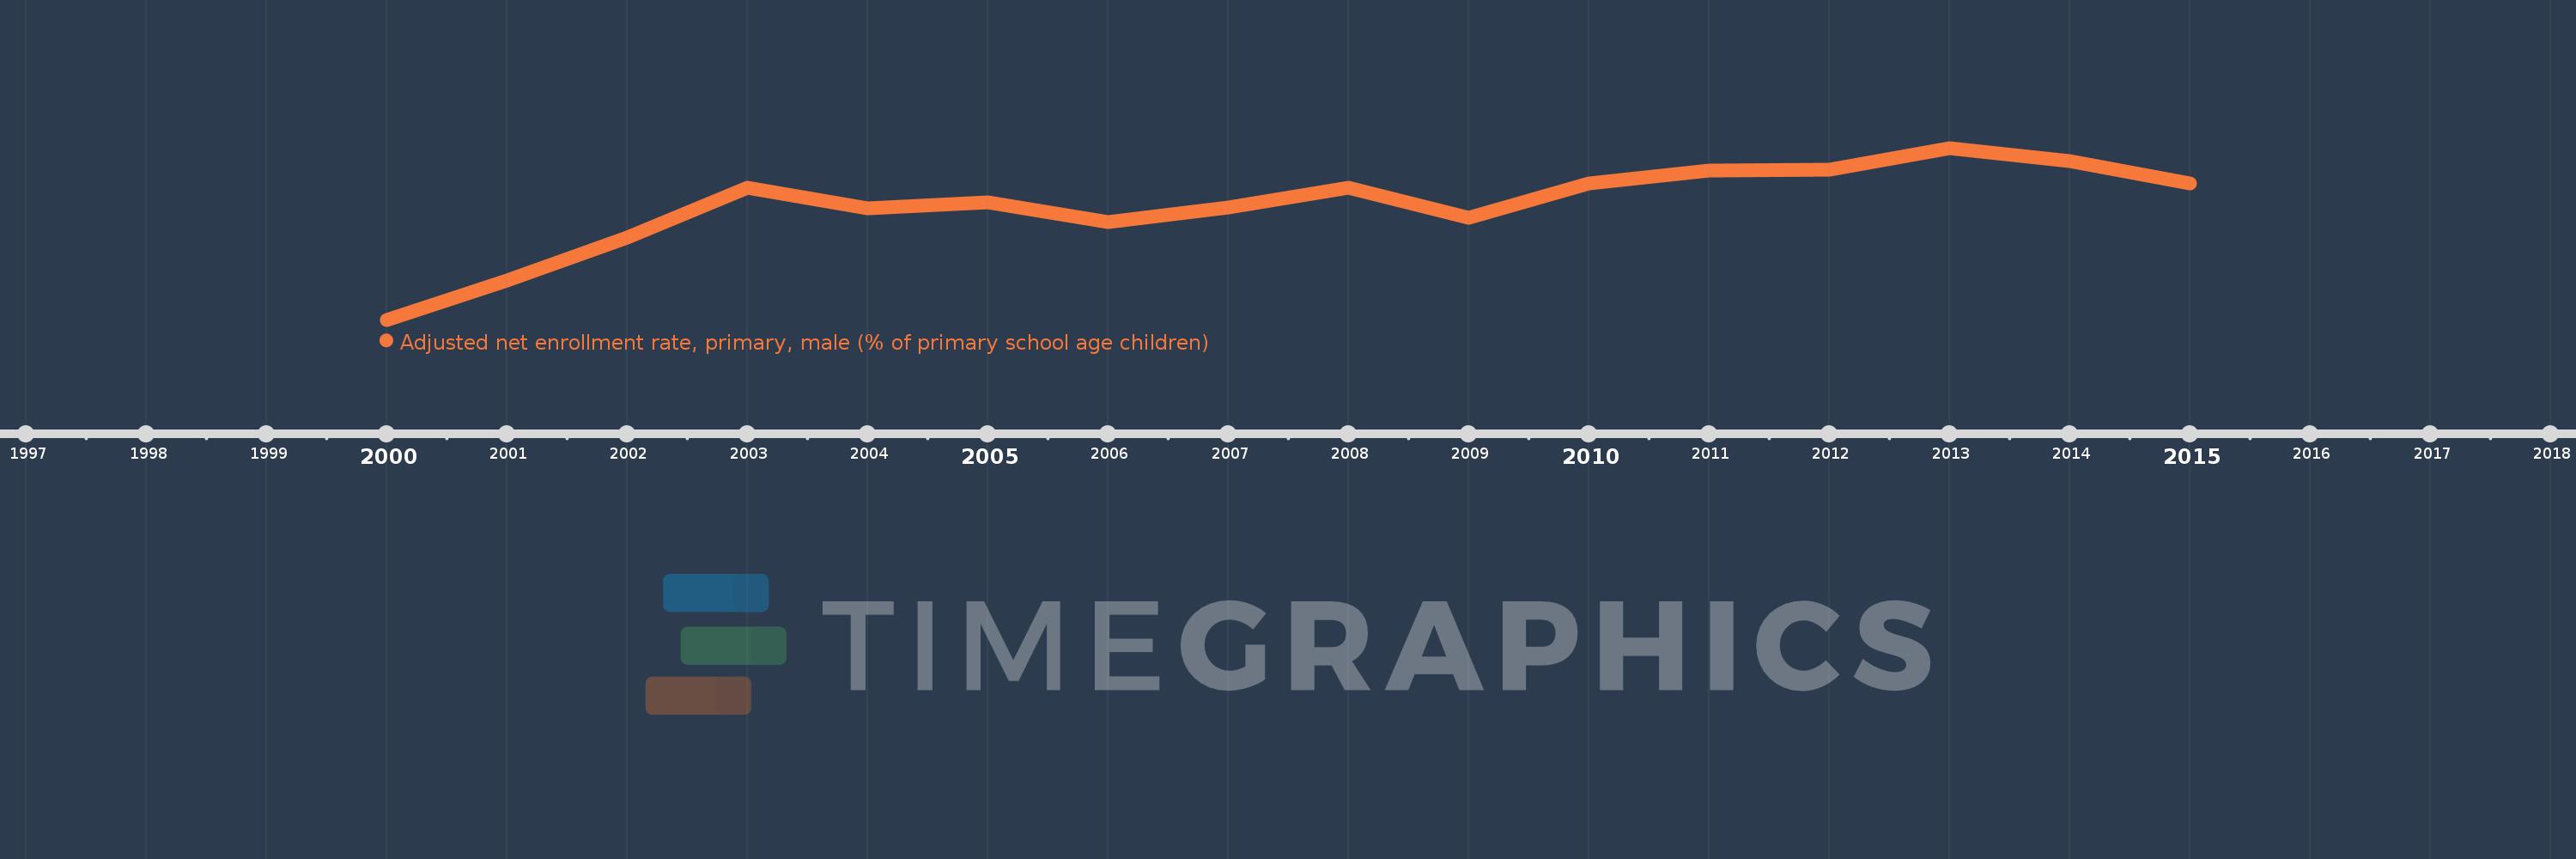
Questa scala temporale mostra un grafico dal 2000 anno al 2015 anno. Venezuela, RB. I dati fino ad 1999 anno non disponibili. Il numero di osservazioni attuali secondo i date: 16.
La fonte (nome):
Indicatori dello sviluppo mondiale
La fonte (organizzazione):
United Nations Educational, Scientific, and Cultural Organization (UNESCO) Institute for Statistics.
Categorie:
Education, Gender
sono stati aggiornati
23 apr 2017 anni
Indicatori delle variazioni dei valori per anni
In media:
91.441
Minima:
84.326
1 gen 2000 anni
Massimo:
95.032
1 gen 2013 anni
Alla data di osservazione
Valore
Variazione assoluta
La variazione rispetto al valore precedente
1 gen 2000 anni
84.326
+84.326
0.0%
1 gen 2001 anni
86.76
+2.434
2.89%
1 gen 2002 anni
89.447
+2.688
3.1%
1 gen 2003 anni
92.558
+3.111
3.48%
1 gen 2004 anni
91.264
-1.294
-1.4%
1 gen 2005 anni
91.625
+0.361
0.4%
1 gen 2006 anni
90.388
-1.237
-1.35%
1 gen 2007 anni
91.303
+0.916
1.01%
1 gen 2008 anni
92.534
+1.231
1.35%
1 gen 2009 anni
90.664
-1.87
-2.02%
1 gen 2010 anni
92.813
+2.149
2.37%
1 gen 2011 anni
93.647
+0.834
0.9%
1 gen 2012 anni
93.671
+0.024
0.03%
1 gen 2013 anni
95.032
+1.361
1.45%
1 gen 2014 anni
94.201
-0.83
-0.87%
1 gen 2015 anni
92.828
-1.373
-1.46%
Classificazione dei paesi secondo i statistiche attuali per anni