33
/it/
AIzaSyB4mHJ5NPEv-XzF7P6NDYXjlkCWaeKw5bc
November 30, 2025
156916
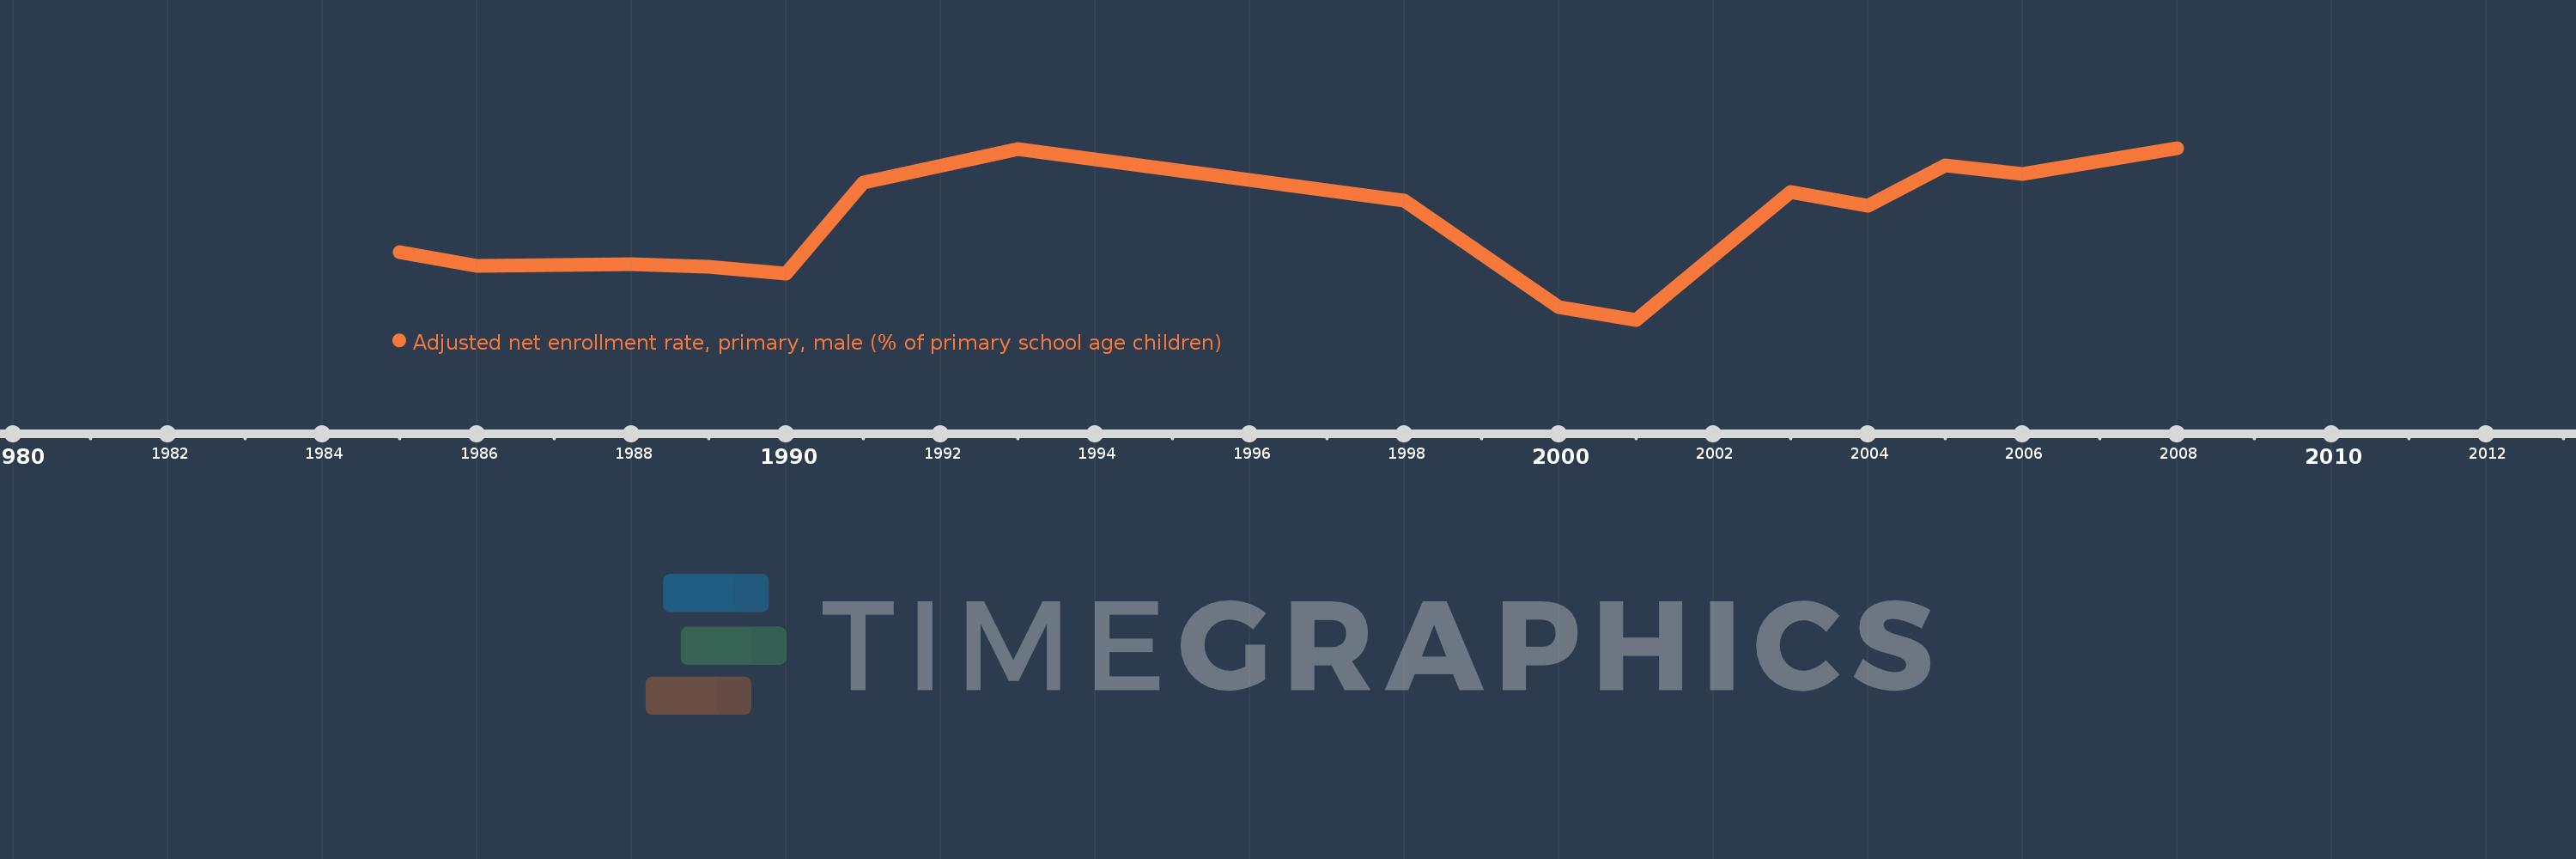
Iran, Islamic Rep.
IRN
true
2
1
Adjusted net enrollment rate, primary, male (% of primary school age children)
2008,2006,2005,2004,2003,2001,2000,1998,1993,1991,1990,1989,1988,1987,1986,1985