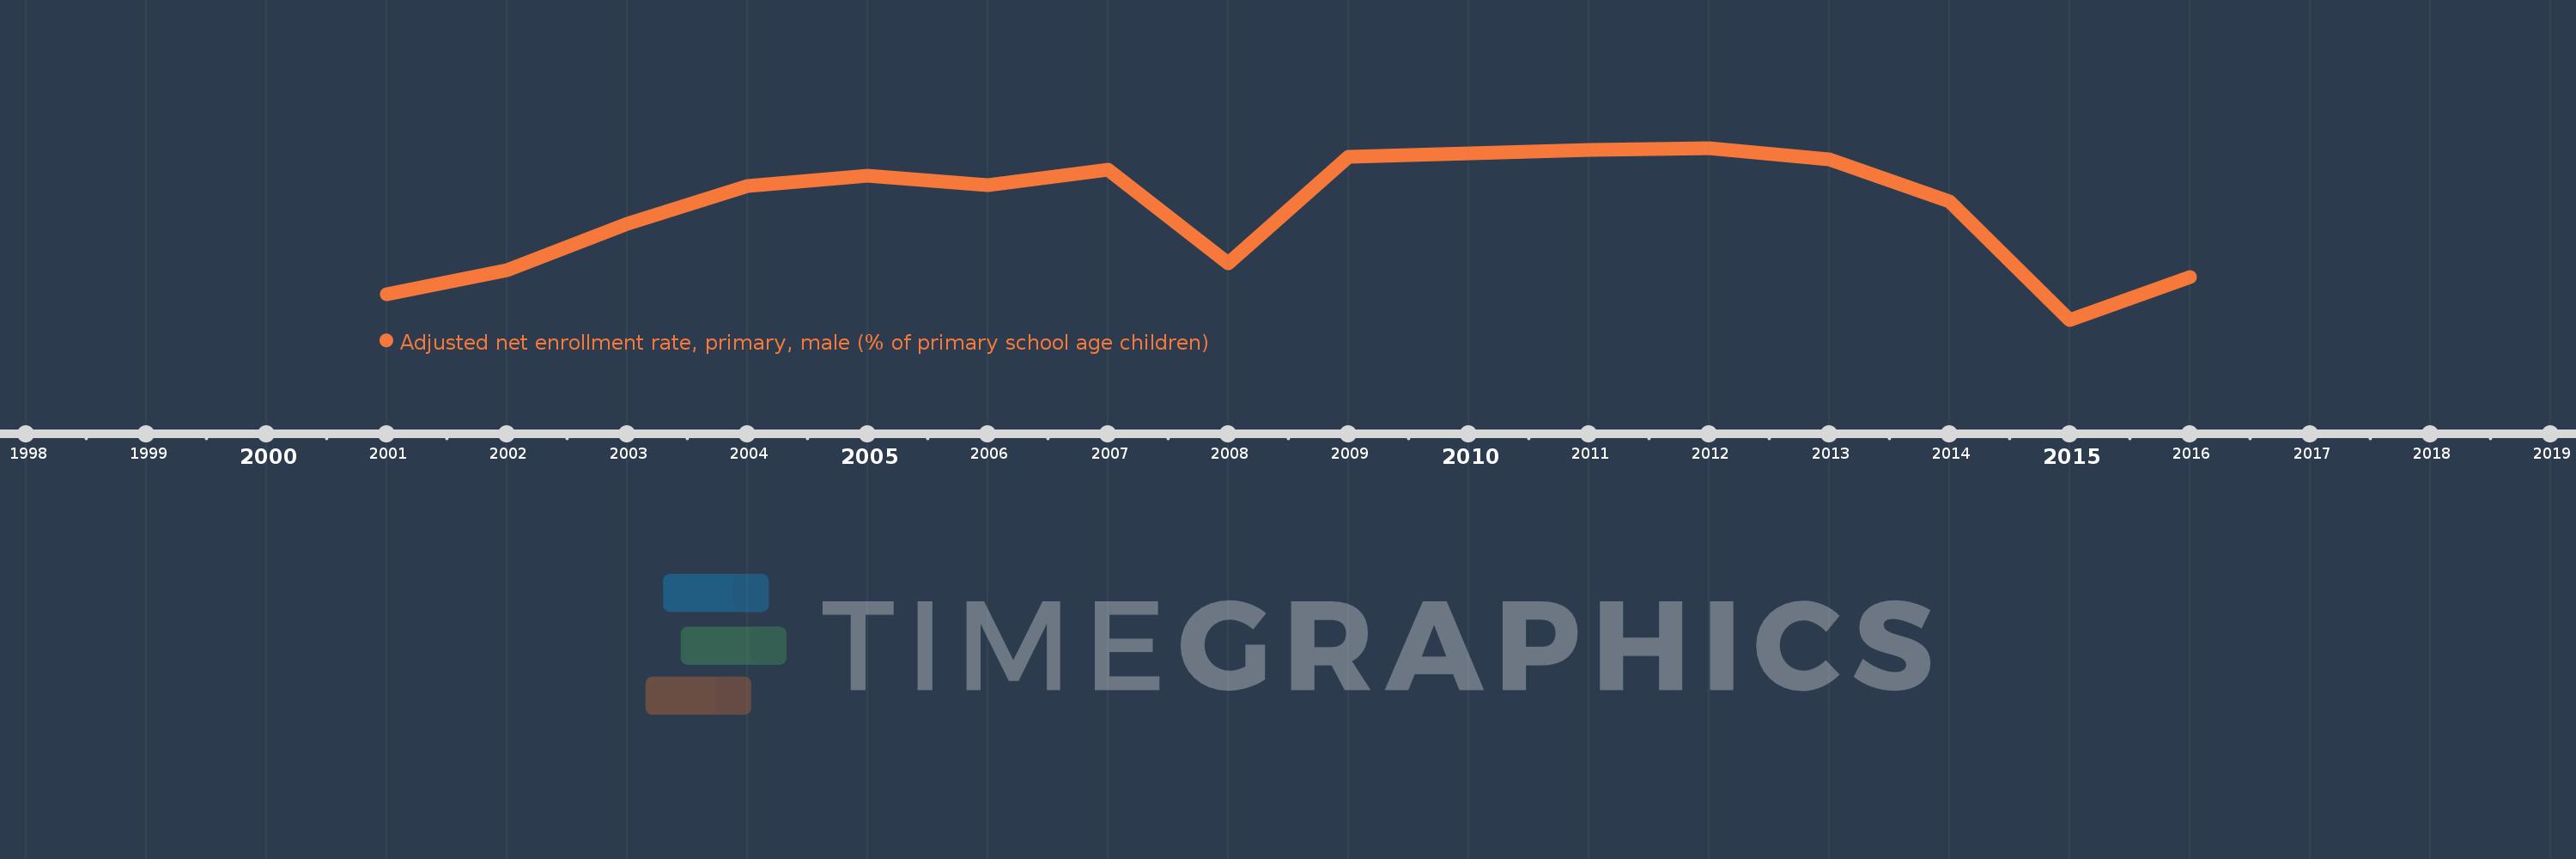
Questa scala temporale mostra un grafico dal 2001 anno al 2016 anno. Tajikistan. I dati fino ad 2000 anno non disponibili. Il numero di osservazioni attuali secondo i date: 16.
La fonte (nome):
Indicatori dello sviluppo mondiale
La fonte (organizzazione):
United Nations Educational, Scientific, and Cultural Organization (UNESCO) Institute for Statistics.
Categorie:
Education, Gender
sono stati aggiornati
23 apr 2017 anni
Indicatori delle variazioni dei valori per anni
In media:
98.766
Minima:
97.388
1 gen 2015 anni
Massimo:
99.513
1 gen 2012 anni
Alla data di osservazione
Valore
Variazione assoluta
La variazione rispetto al valore precedente
1 gen 2001 anni
97.706
+97.706
0.0%
1 gen 2002 anni
98.005
+0.299
0.31%
1 gen 2003 anni
98.574
+0.569
0.58%
1 gen 2004 anni
99.043
+0.469
0.48%
1 gen 2005 anni
99.171
+0.129
0.13%
1 gen 2006 anni
99.05
-0.121
-0.12%
1 gen 2007 anni
99.248
+0.198
0.2%
1 gen 2008 anni
98.082
-1.166
-1.18%
1 gen 2009 anni
99.401
+1.319
1.34%
1 gen 2010 anni
99.448
+0.047
0.05%
1 gen 2011 anni
99.485
+0.037
0.04%
1 gen 2012 anni
99.513
+0.028
0.03%
1 gen 2013 anni
99.372
-0.141
-0.14%
1 gen 2014 anni
98.856
-0.516
-0.52%
1 gen 2015 anni
97.388
-1.468
-1.48%
1 gen 2016 anni
97.912
+0.523
0.54%
Classificazione dei paesi secondo i statistiche attuali per anni