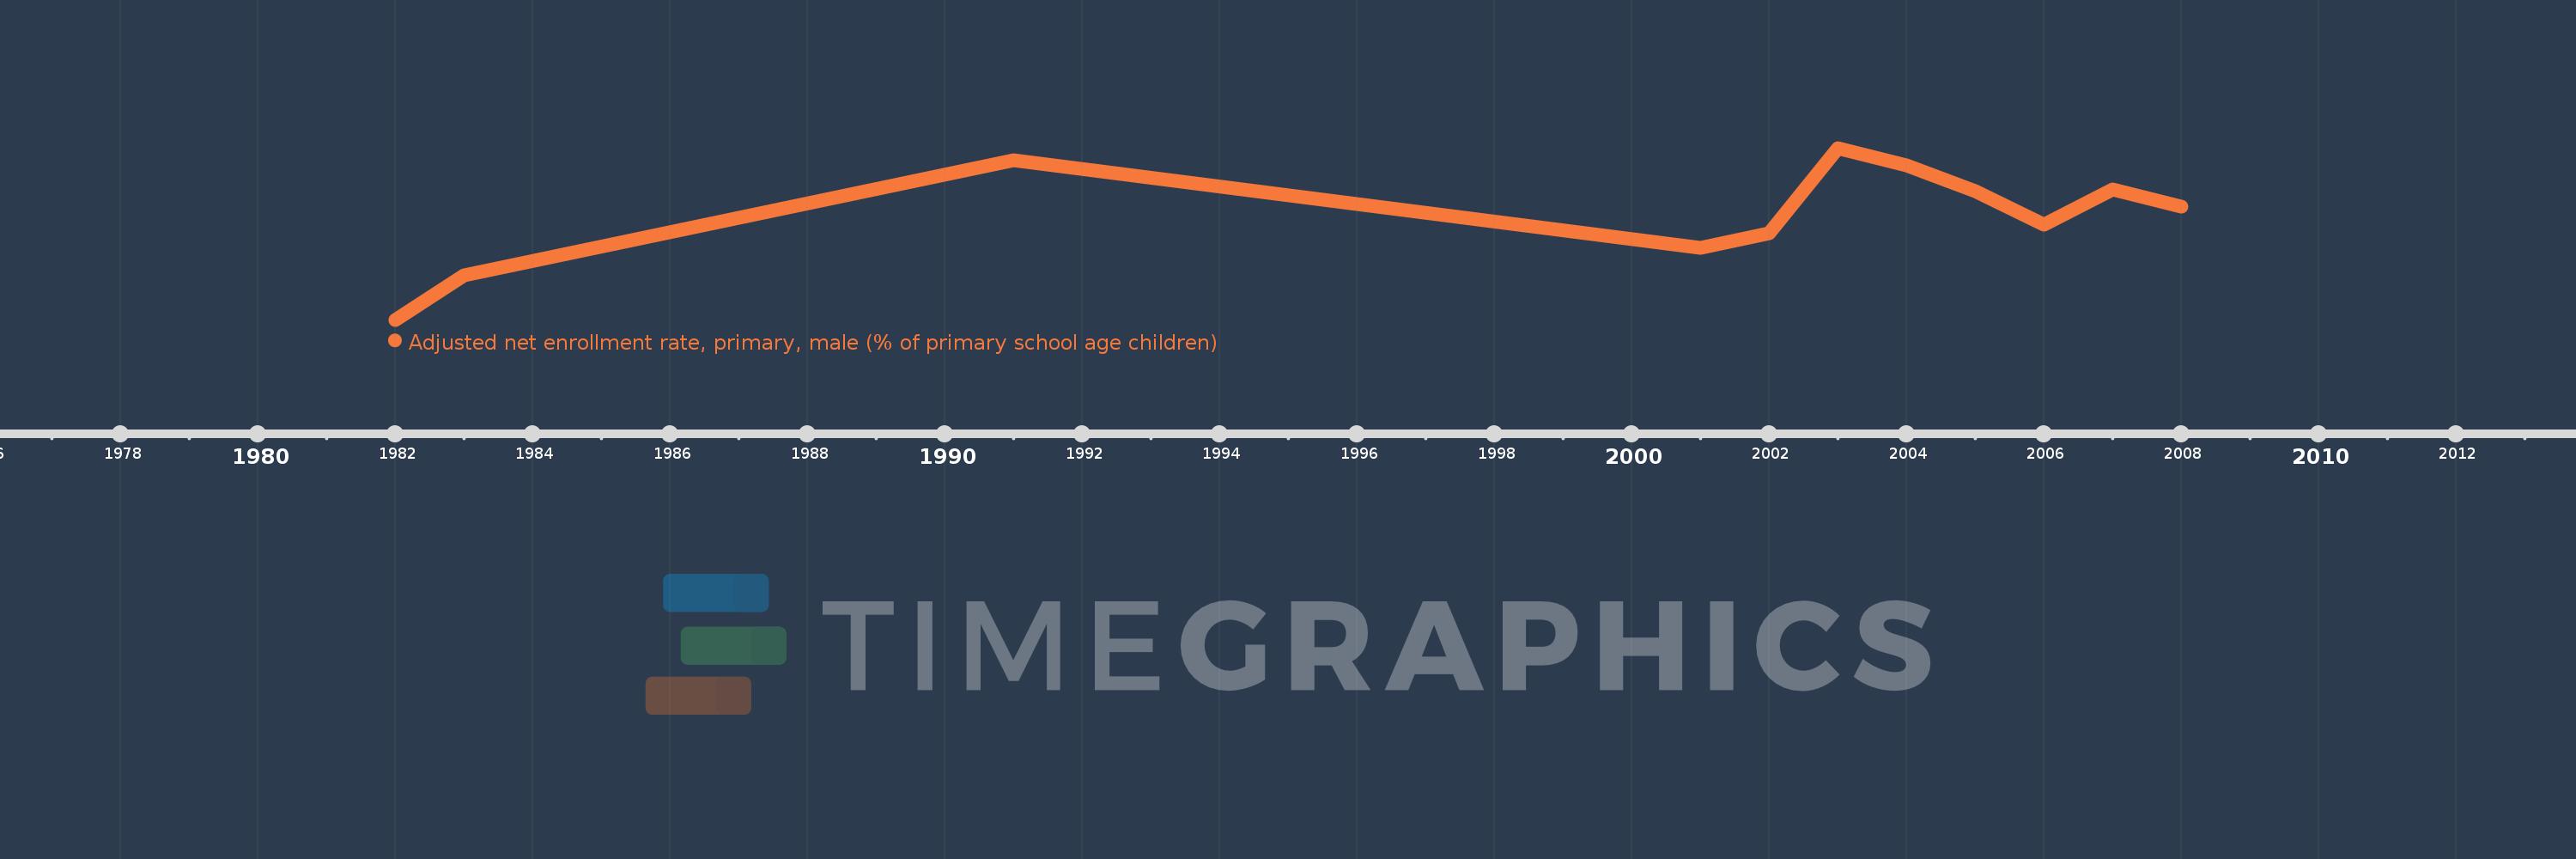
Questa scala temporale mostra un grafico dal 1982 anno al 2008 anno. St. Lucia. I dati fino ad 1981 anno non disponibili. Il numero di osservazioni attuali secondo i date: 11.
La fonte (nome):
Indicatori dello sviluppo mondiale
La fonte (organizzazione):
United Nations Educational, Scientific, and Cultural Organization (UNESCO) Institute for Statistics.
Categorie:
Education, Gender
sono stati aggiornati
23 apr 2017 anni
Indicatori delle variazioni dei valori per anni
In media:
94.906
Minima:
87.634
1 gen 1982 anni
Massimo:
99.522
1 gen 2003 anni
Alla data di osservazione
Valore
Variazione assoluta
La variazione rispetto al valore precedente
1 gen 1982 anni
87.634
+87.634
0.0%
1 gen 1983 anni
90.724
+3.09
3.53%
1 gen 1991 anni
98.681
+7.957
8.77%
1 gen 2001 anni
92.604
-6.077
-6.16%
1 gen 2002 anni
93.632
+1.028
1.11%
1 gen 2003 anni
99.522
+5.89
6.29%
1 gen 2004 anni
98.313
-1.209
-1.21%
1 gen 2005 anni
96.537
-1.776
-1.81%
1 gen 2006 anni
94.223
-2.314
-2.4%
1 gen 2007 anni
96.66
+2.437
2.59%
1 gen 2008 anni
95.434
-1.226
-1.27%
Classificazione dei paesi secondo i statistiche attuali per anni