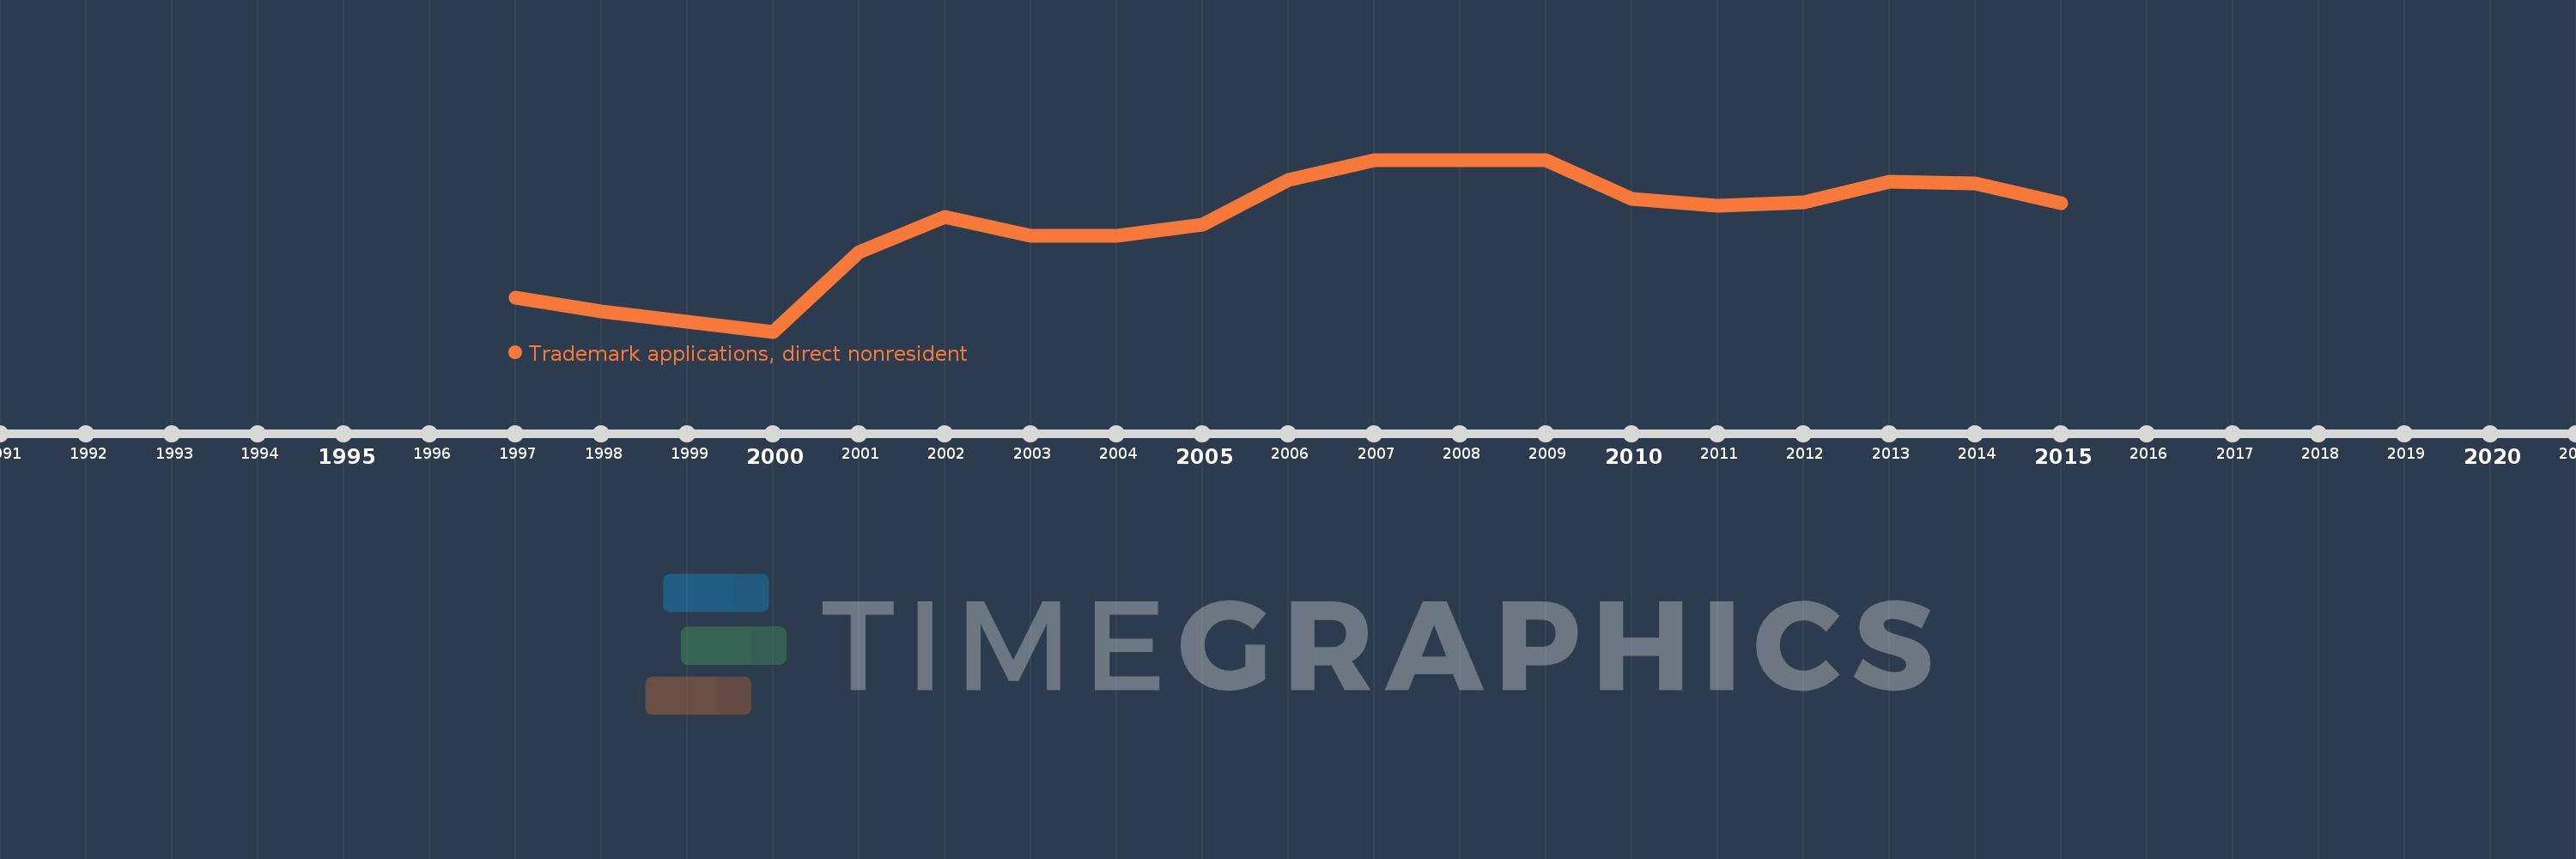
Questa scala temporale mostra un grafico dal 1997 anno al 2015 anno. Turkmenistan. I dati fino ad 1996 anno non disponibili. Il numero di osservazioni attuali secondo i date: 19.
La fonte (nome):
Indicatori dello sviluppo mondiale
La fonte (organizzazione):
World Intellectual Property Organization (WIPO), WIPO Patent Report: Statistics on Worldwide Patent Activity. The International Bureau of WIPO assumes no responsibility with respect to the transformation of these data.
Categorie:
Science & Technology
sono stati aggiornati
23 apr 2017 anni
Indicatori delle variazioni dei valori per anni
In media:
2.016 Mille.
Minima:
678.0
1 gen 2000 anni
Massimo:
2.821 Mille.
1 gen 2008 anni
Alla data di osservazione
Valore
Variazione assoluta
La variazione rispetto al valore precedente
1 gen 1997 anni
1.096 Mille.
+1.096 Mille.
0.0%
1 gen 1998 anni
929.0
-167.0
-15.24%
1 gen 1999 anni
803.0
-126.0
-13.56%
1 gen 2000 anni
678.0
-125.0
-15.57%
1 gen 2001 anni
1.669 Mille.
+991.0
146.17%
1 gen 2002 anni
2.111 Mille.
+442.0
26.48%
1 gen 2003 anni
1.869 Mille.
-242.0
-11.46%
1 gen 2004 anni
1.876 Mille.
+7.0
0.37%
1 gen 2005 anni
2.013 Mille.
+137.0
7.3%
1 gen 2006 anni
2.565 Mille.
+552.0
27.42%
1 gen 2007 anni
2.817 Mille.
+252.0
9.82%
1 gen 2008 anni
2.821 Mille.
+4.0
0.14%
1 gen 2009 anni
2.819 Mille.
-2.0
-0.07%
1 gen 2010 anni
2.337 Mille.
-482.0
-17.1%
1 gen 2011 anni
2.245 Mille.
-92.0
-3.94%
1 gen 2012 anni
2.293 Mille.
+48.0
2.14%
1 gen 2013 anni
2.549 Mille.
+256.0
11.16%
1 gen 2014 anni
2.529 Mille.
-20.0
-0.78%
1 gen 2015 anni
2.283 Mille.
-246.0
-9.73%
Classificazione dei paesi secondo i statistiche attuali per anni