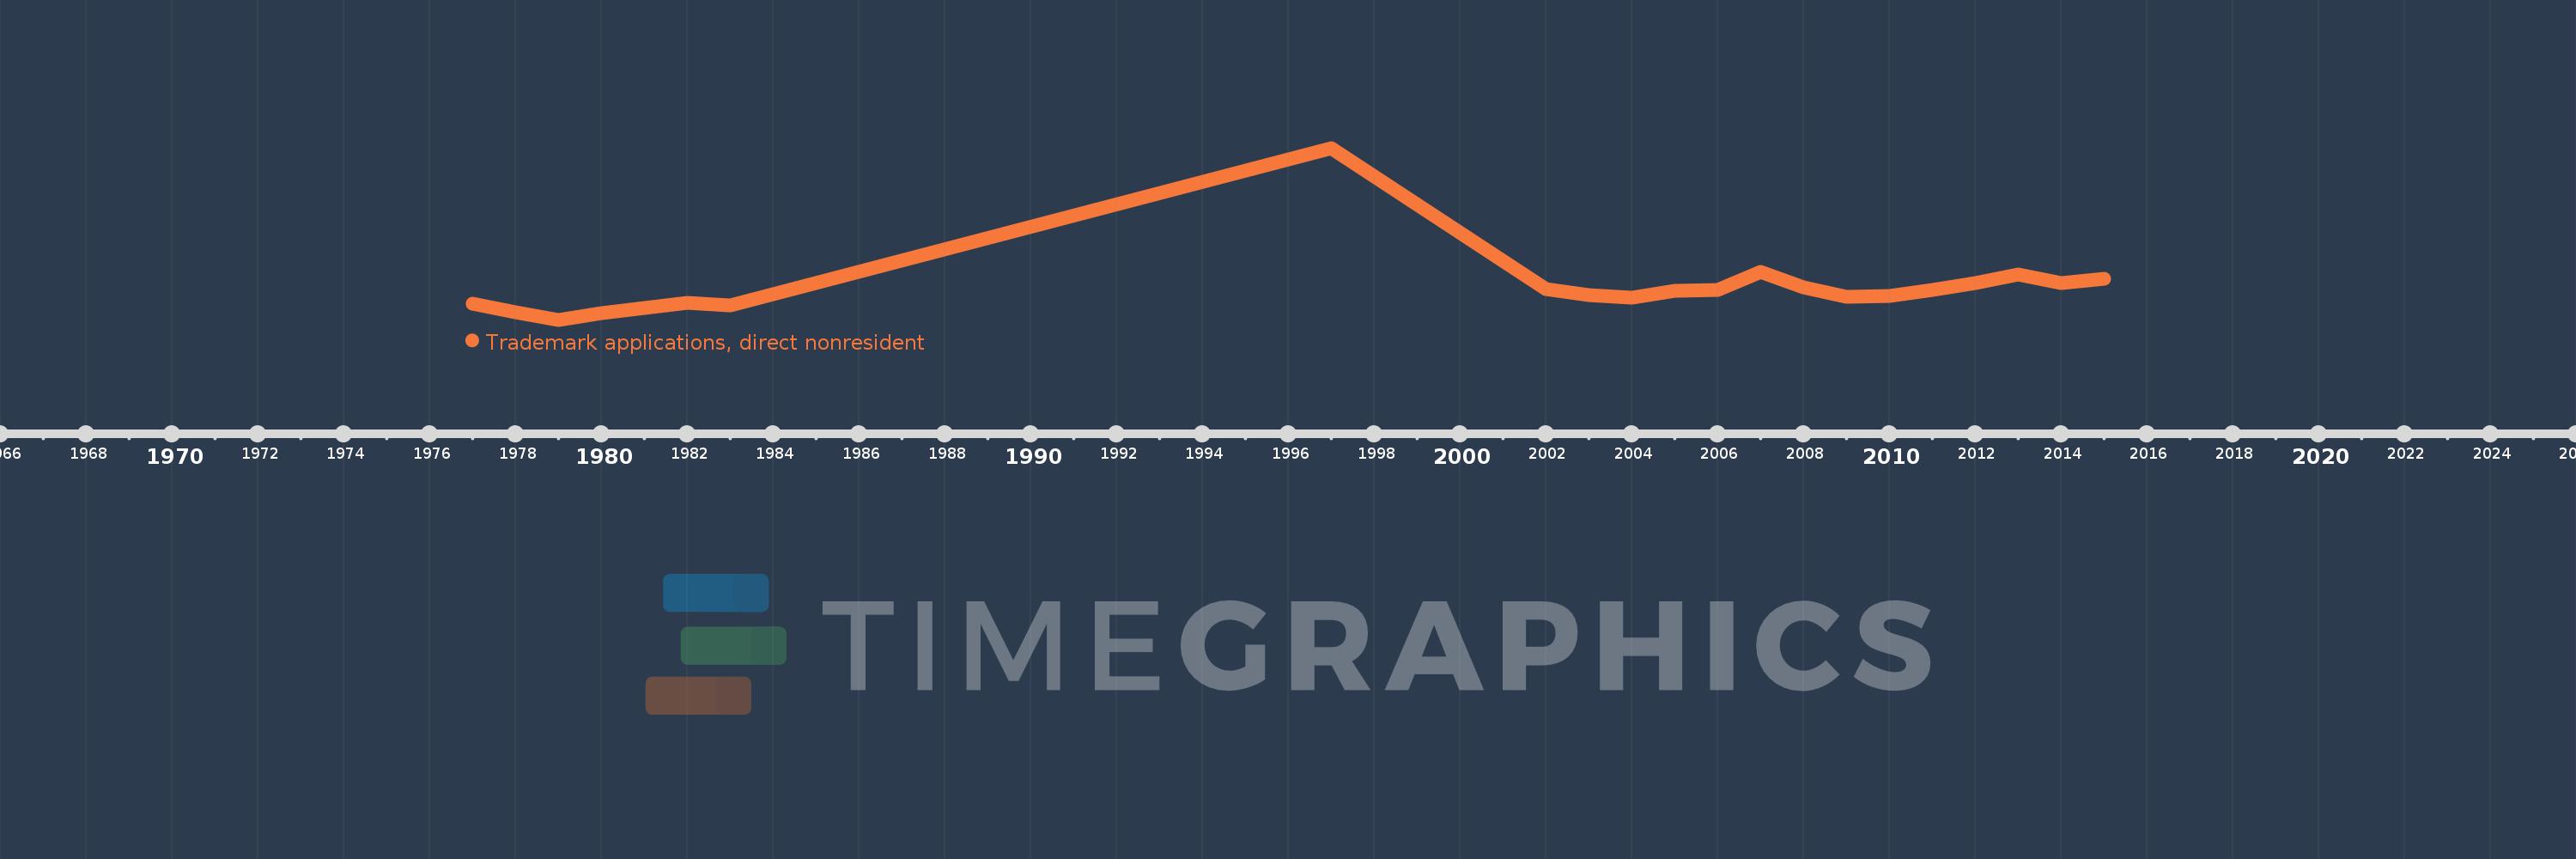
Questa scala temporale mostra un grafico dal 1977 anno al 2015 anno. Suriname. I dati fino ad 1976 anno non disponibili. Il numero di osservazioni attuali secondo i date: 21.
La fonte (nome):
Indicatori dello sviluppo mondiale
La fonte (organizzazione):
World Intellectual Property Organization (WIPO), WIPO Patent Report: Statistics on Worldwide Patent Activity. The International Bureau of WIPO assumes no responsibility with respect to the transformation of these data.
Categorie:
Science & Technology
sono stati aggiornati
23 apr 2017 anni
Indicatori delle variazioni dei valori per anni
In media:
452.429
Minima:
215.0
1 gen 1979 anni
Massimo:
1.462 Mille.
1 gen 1997 anni
Alla data di osservazione
Valore
Variazione assoluta
La variazione rispetto al valore precedente
1 gen 1977 anni
330.0
+330.0
0.0%
1 gen 1978 anni
271.0
-59.0
-17.88%
1 gen 1979 anni
215.0
-56.0
-20.66%
1 gen 1980 anni
265.0
+50.0
23.26%
1 gen 1982 anni
337.0
+72.0
27.17%
1 gen 1983 anni
321.0
-16.0
-4.75%
1 gen 1997 anni
1.462 Mille.
+1.141 Mille.
355.45%
1 gen 2002 anni
437.0
-1.025 Mille.
-70.11%
1 gen 2003 anni
397.0
-40.0
-9.15%
1 gen 2004 anni
377.0
-20.0
-5.04%
1 gen 2005 anni
425.0
+48.0
12.73%
1 gen 2006 anni
430.0
+5.0
1.18%
1 gen 2007 anni
561.0
+131.0
30.47%
1 gen 2008 anni
451.0
-110.0
-19.61%
1 gen 2009 anni
381.0
-70.0
-15.52%
1 gen 2010 anni
388.0
+7.0
1.84%
1 gen 2011 anni
429.0
+41.0
10.57%
1 gen 2012 anni
480.0
+51.0
11.89%
1 gen 2013 anni
546.0
+66.0
13.75%
1 gen 2014 anni
483.0
-63.0
-11.54%
1 gen 2015 anni
515.0
+32.0
6.63%
Classificazione dei paesi secondo i statistiche attuali per anni