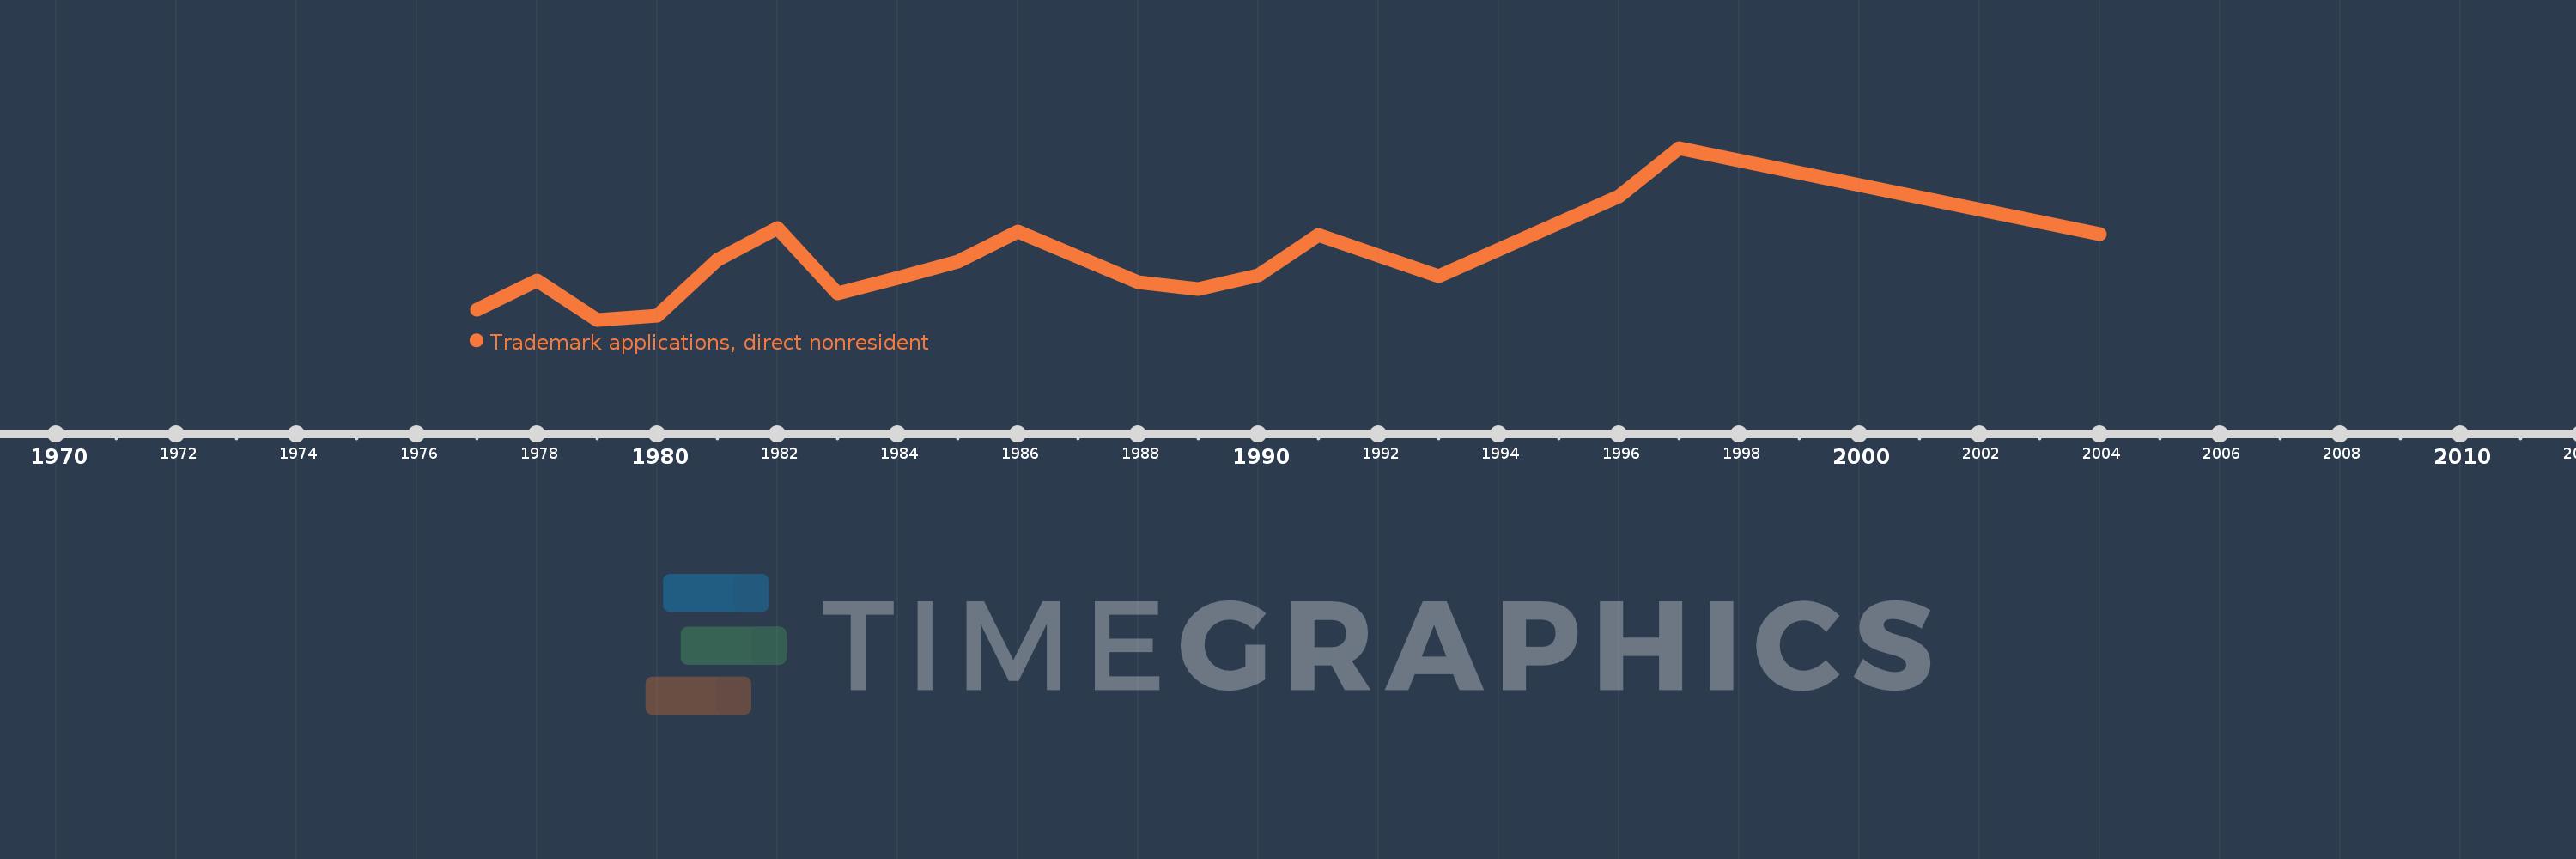
Questa scala temporale mostra un grafico dal 1977 anno al 2004 anno. Seychelles. I dati fino ad 1976 anno non disponibili. Il numero di osservazioni attuali secondo i date: 19.
La fonte (nome):
Indicatori dello sviluppo mondiale
La fonte (organizzazione):
World Intellectual Property Organization (WIPO), WIPO Patent Report: Statistics on Worldwide Patent Activity. The International Bureau of WIPO assumes no responsibility with respect to the transformation of these data.
Categorie:
Science & Technology
sono stati aggiornati
23 apr 2017 anni
Indicatori delle variazioni dei valori per anni
In media:
143.789
Minima:
32.0
1 gen 1979 anni
Massimo:
362.0
1 gen 1997 anni
Alla data di osservazione
Valore
Variazione assoluta
La variazione rispetto al valore precedente
1 gen 1977 anni
52.0
+52.0
0.0%
1 gen 1978 anni
108.0
+56.0
107.69%
1 gen 1979 anni
32.0
-76.0
-70.37%
1 gen 1980 anni
39.0
+7.0
21.88%
1 gen 1981 anni
147.0
+108.0
276.92%
1 gen 1982 anni
208.0
+61.0
41.5%
1 gen 1983 anni
82.0
-126.0
-60.58%
1 gen 1984 anni
113.0
+31.0
37.8%
1 gen 1985 anni
144.0
+31.0
27.43%
1 gen 1986 anni
201.0
+57.0
39.58%
1 gen 1988 anni
104.0
-97.0
-48.26%
1 gen 1989 anni
91.0
-13.0
-12.5%
1 gen 1990 anni
118.0
+27.0
29.67%
1 gen 1991 anni
195.0
+77.0
65.25%
1 gen 1992 anni
156.0
-39.0
-20.0%
1 gen 1993 anni
115.0
-41.0
-26.28%
1 gen 1996 anni
269.0
+154.0
133.91%
1 gen 1997 anni
362.0
+93.0
34.57%
1 gen 2004 anni
196.0
-166.0
-45.86%
Classificazione dei paesi secondo i statistiche attuali per anni