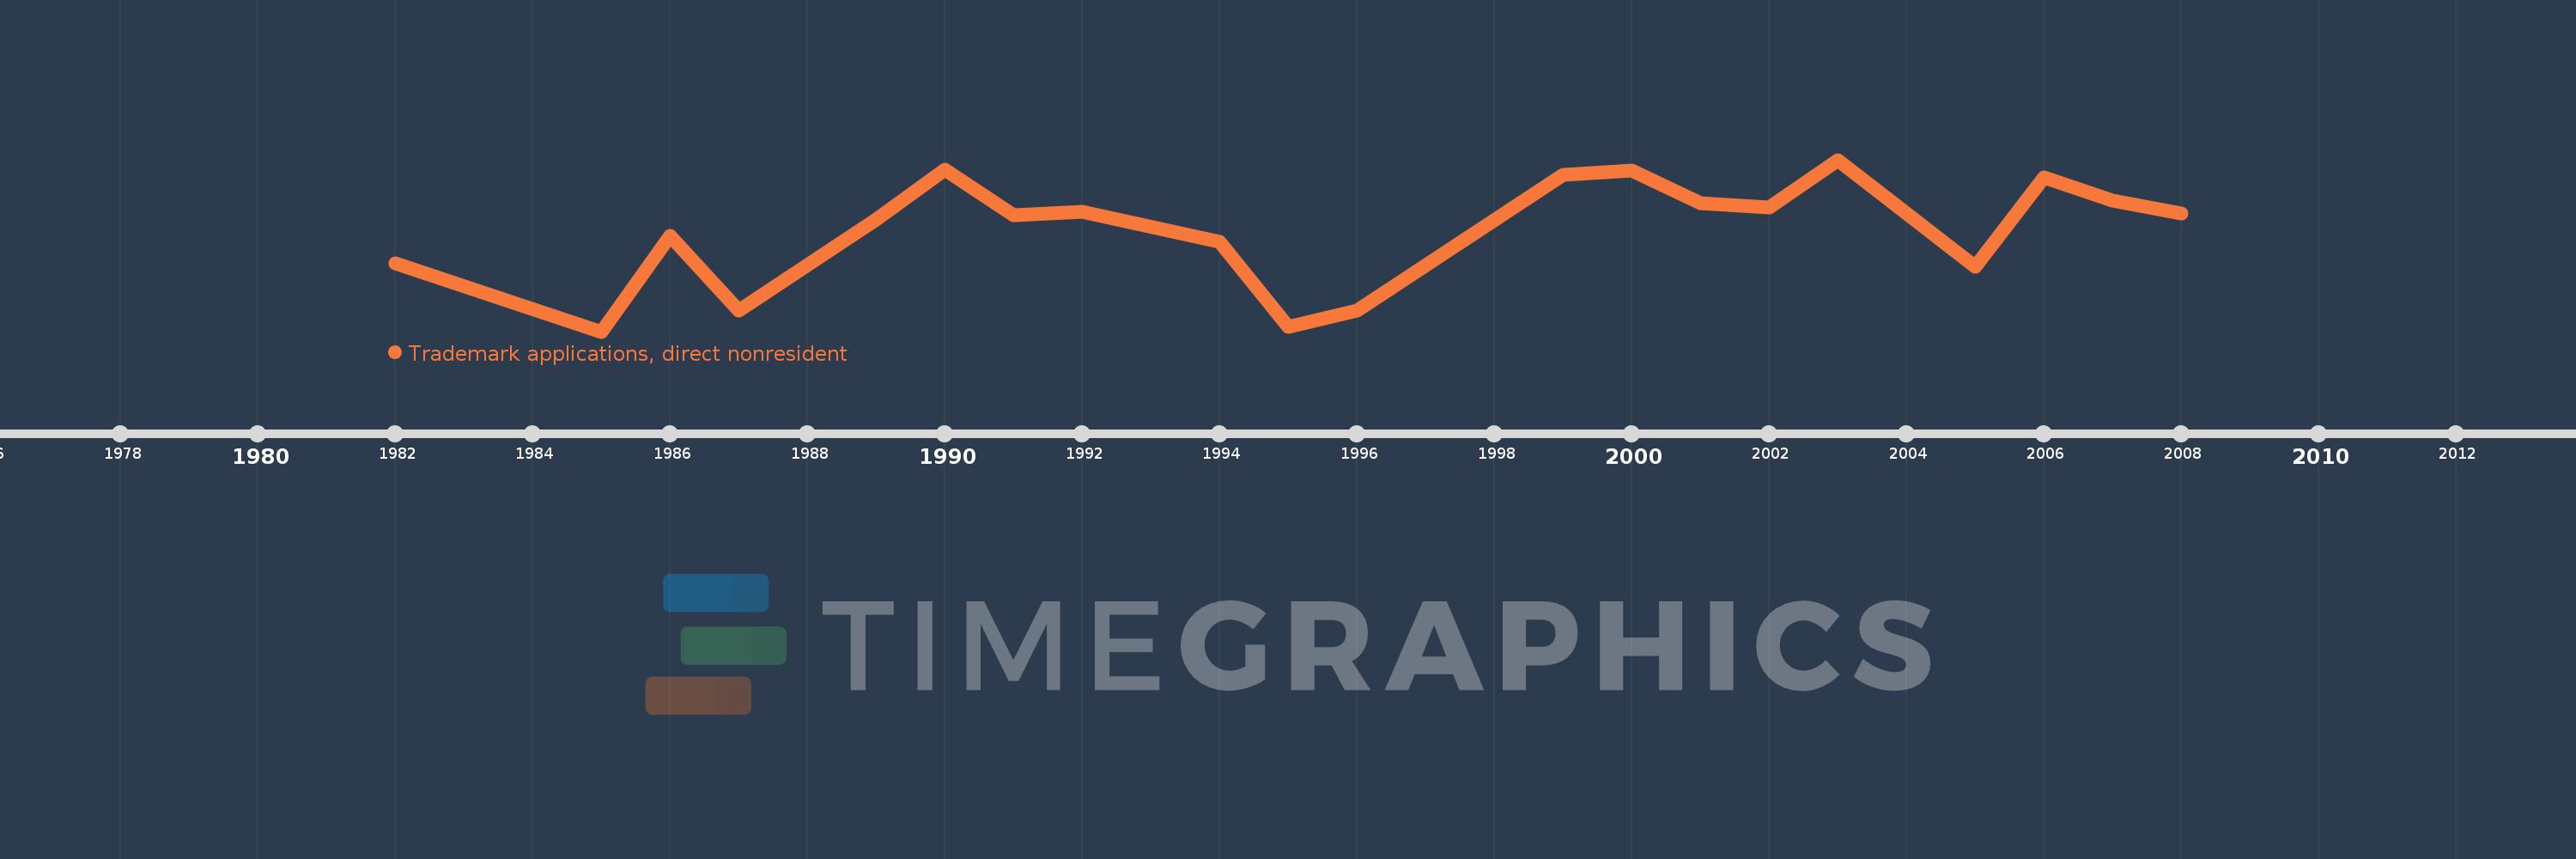
Questa scala temporale mostra un grafico dal 1982 anno al 2008 anno. Ethiopia. I dati fino ad 1981 anno non disponibili. Il numero di osservazioni attuali secondo i date: 21.
La fonte (nome):
Indicatori dello sviluppo mondiale
La fonte (organizzazione):
World Intellectual Property Organization (WIPO), WIPO Patent Report: Statistics on Worldwide Patent Activity. The International Bureau of WIPO assumes no responsibility with respect to the transformation of these data.
Categorie:
Science & Technology
sono stati aggiornati
23 apr 2017 anni
Indicatori delle variazioni dei valori per anni
In media:
261.19
Minima:
62.0
1 gen 1985 anni
Massimo:
398.0
1 gen 2003 anni
Alla data di osservazione
Valore
Variazione assoluta
La variazione rispetto al valore precedente
1 gen 1982 anni
195.0
+195.0
0.0%
1 gen 1985 anni
62.0
-133.0
-68.21%
1 gen 1986 anni
249.0
+187.0
301.61%
1 gen 1987 anni
103.0
-146.0
-58.63%
1 gen 1989 anni
282.0
+179.0
173.79%
1 gen 1990 anni
378.0
+96.0
34.04%
1 gen 1991 anni
289.0
-89.0
-23.54%
1 gen 1992 anni
296.0
+7.0
2.42%
1 gen 1994 anni
238.0
-58.0
-19.59%
1 gen 1995 anni
72.0
-166.0
-69.75%
1 gen 1996 anni
103.0
+31.0
43.06%
1 gen 1999 anni
368.0
+265.0
257.28%
1 gen 2000 anni
377.0
+9.0
2.45%
1 gen 2001 anni
313.0
-64.0
-16.98%
1 gen 2002 anni
305.0
-8.0
-2.56%
1 gen 2003 anni
398.0
+93.0
30.49%
1 gen 2004 anni
293.0
-105.0
-26.38%
1 gen 2005 anni
189.0
-104.0
-35.49%
1 gen 2006 anni
363.0
+174.0
92.06%
1 gen 2007 anni
319.0
-44.0
-12.12%
1 gen 2008 anni
293.0
-26.0
-8.15%
Classificazione dei paesi secondo i statistiche attuali per anni