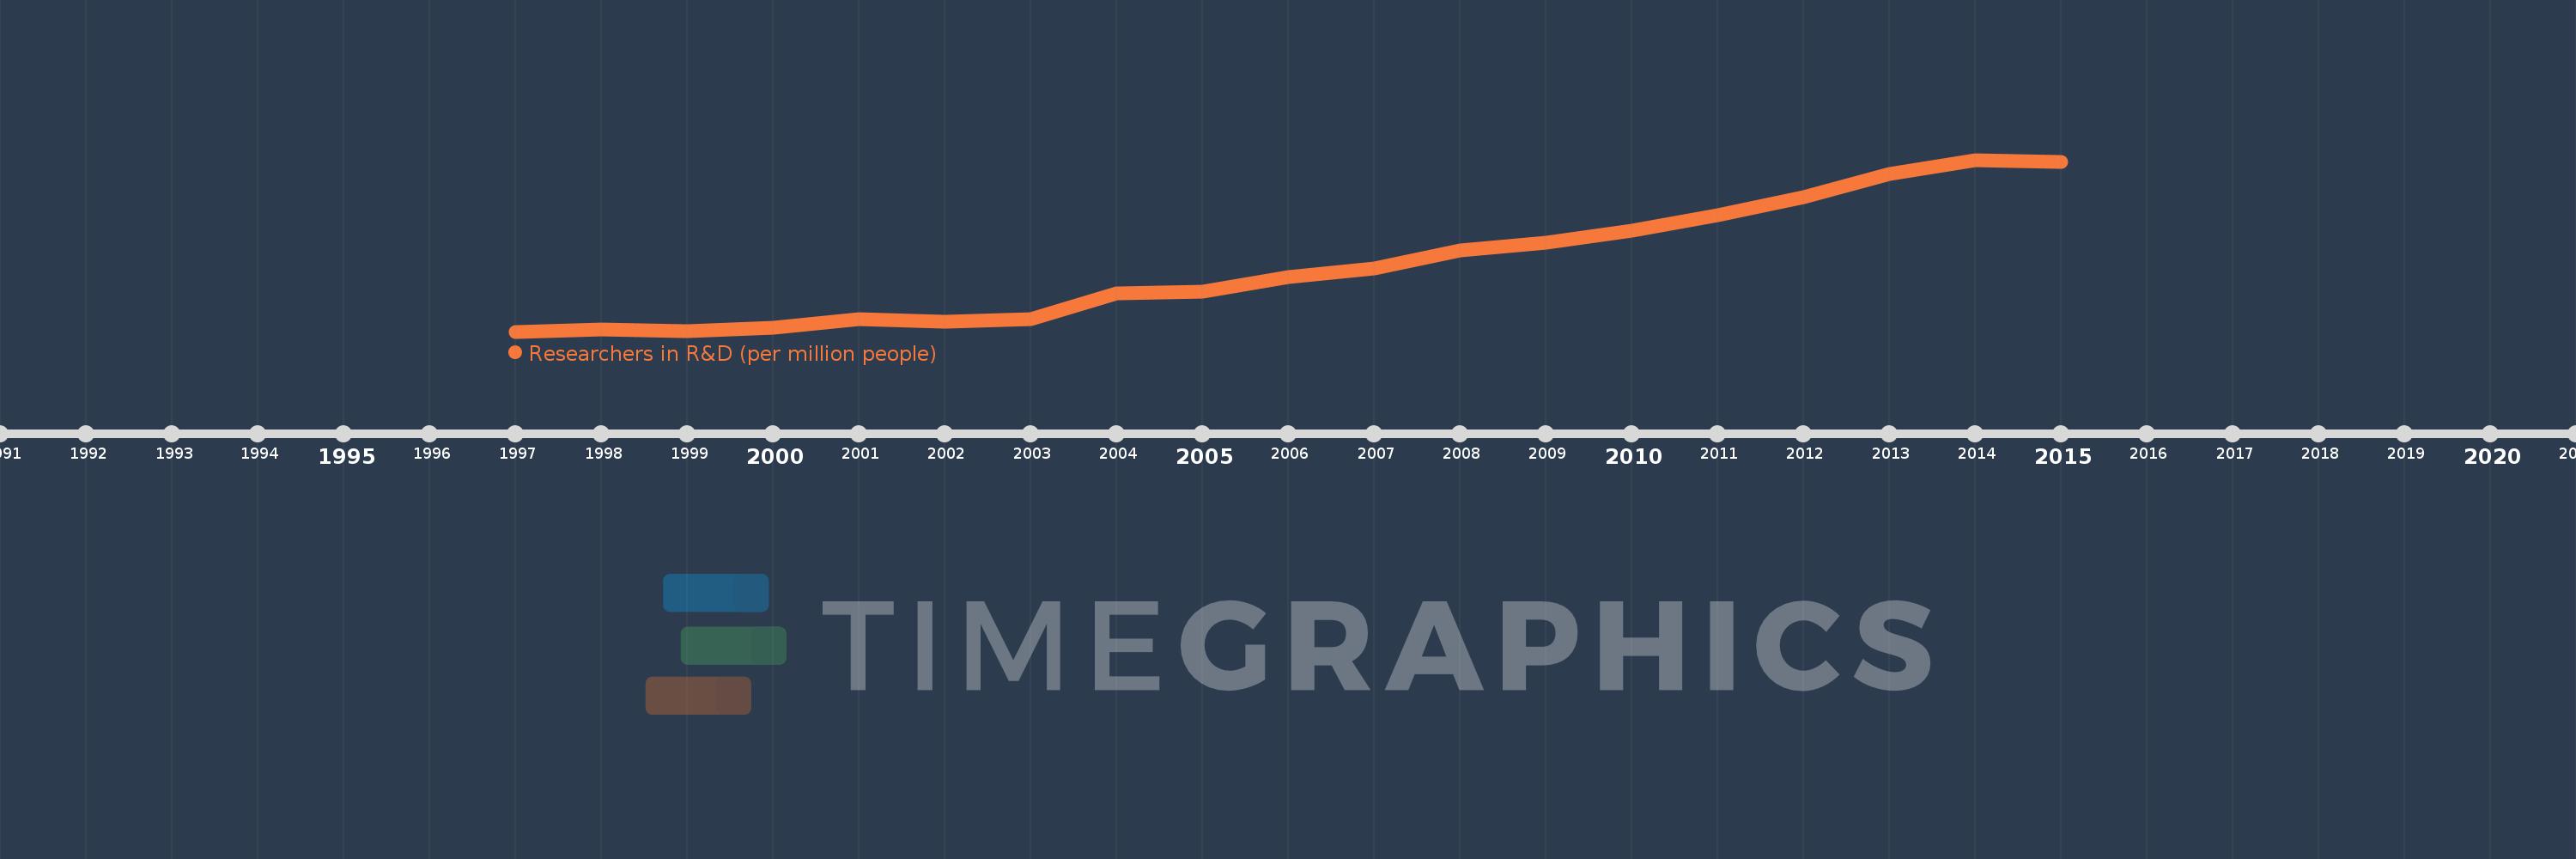
Questa scala temporale mostra un grafico dal 1997 anno al 2015 anno. Turkey. I dati fino ad 1996 anno non disponibili. Il numero di osservazioni attuali secondo i date: 19.
La fonte (nome):
Indicatori dello sviluppo mondiale
La fonte (organizzazione):
United Nations Educational, Scientific, and Cultural Organization (UNESCO) Institute for Statistics.
Categorie:
Science & Technology
sono stati aggiornati
23 apr 2017 anni
Indicatori delle variazioni dei valori per anni
In media:
636.928
Minima:
304.198
1 gen 1997 anni
Massimo:
1.169 Mille.
1 gen 2014 anni
Alla data di osservazione
Valore
Variazione assoluta
La variazione rispetto al valore precedente
1 gen 1997 anni
304.198
+304.198
0.0%
1 gen 1998 anni
313.077
+8.879
2.92%
1 gen 1999 anni
308.502
-4.575
-1.46%
1 gen 2000 anni
322.093
+13.592
4.41%
1 gen 2001 anni
365.005
+42.912
13.32%
1 gen 2002 anni
353.709
-11.296
-3.09%
1 gen 2003 anni
368.441
+14.732
4.16%
1 gen 2004 anni
494.398
+125.957
34.19%
1 gen 2005 anni
505.82
+11.422
2.31%
1 gen 2006 anni
576.755
+70.936
14.02%
1 gen 2007 anni
620.969
+44.213
7.67%
1 gen 2008 anni
714.486
+93.518
15.06%
1 gen 2009 anni
750.748
+36.261
5.08%
1 gen 2010 anni
810.518
+59.77
7.96%
1 gen 2011 anni
889.788
+79.27
9.78%
1 gen 2012 anni
980.842
+91.054
10.23%
1 gen 2013 anni
1.097 Mille.
+116.33
11.86%
1 gen 2014 anni
1.169 Mille.
+71.427
6.51%
1 gen 2015 anni
1.157 Mille.
-12.086
-1.03%
Classificazione dei paesi secondo i statistiche attuali per anni