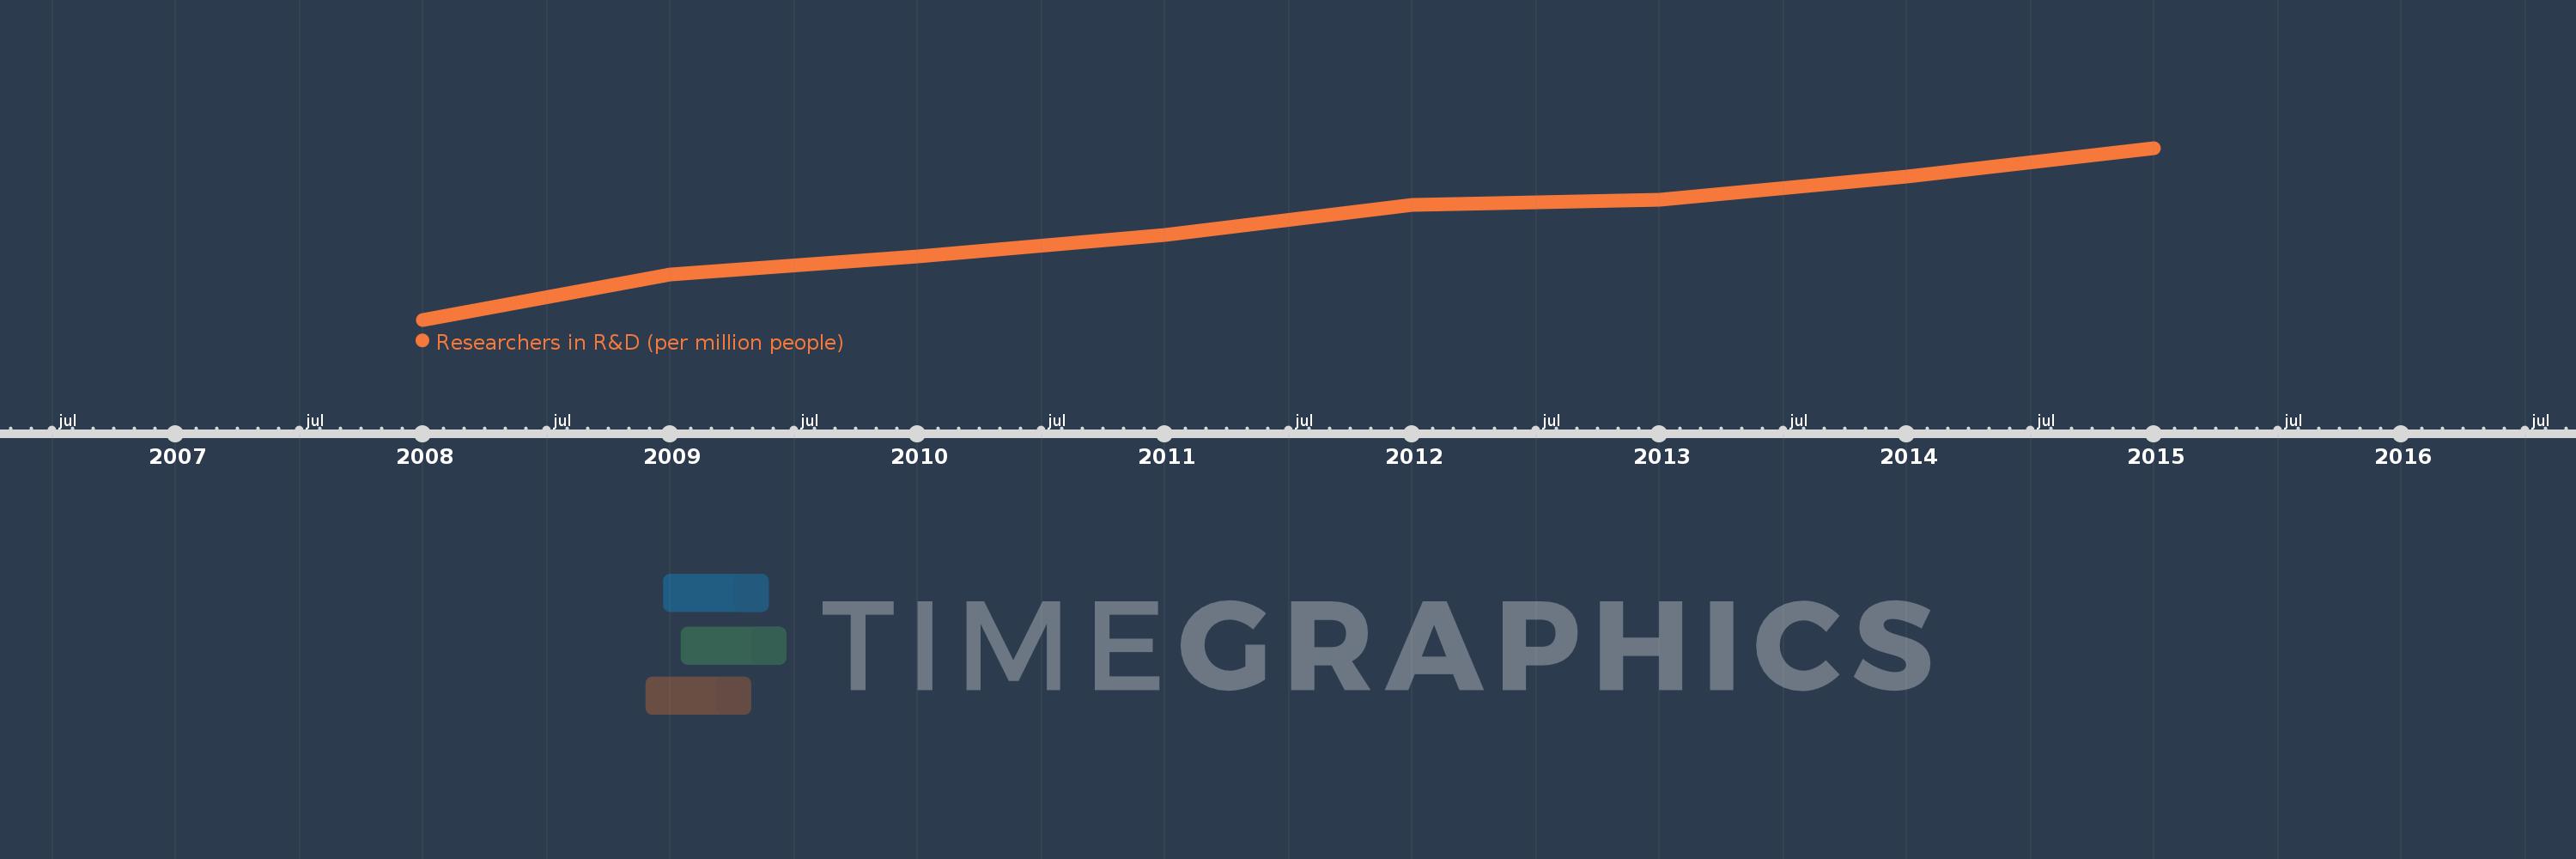
Questa scala temporale mostra un grafico dal 2008 anno al 2015 anno. Serbia. I dati fino ad 2007 anno non disponibili. Il numero di osservazioni attuali secondo i date: 8.
La fonte (nome):
Indicatori dello sviluppo mondiale
La fonte (organizzazione):
United Nations Educational, Scientific, and Cultural Organization (UNESCO) Institute for Statistics.
Categorie:
Science & Technology
sono stati aggiornati
23 apr 2017 anni
Indicatori delle variazioni dei valori per anni
In media:
1.235 Mille.
Minima:
964.486
1 gen 2008 anni
Massimo:
1.465 Mille.
1 gen 2015 anni
Alla data di osservazione
Valore
Variazione assoluta
La variazione rispetto al valore precedente
1 gen 2008 anni
964.486
+964.486
0.0%
1 gen 2009 anni
1.095 Mille.
+130.872
13.57%
1 gen 2010 anni
1.149 Mille.
+53.967
4.93%
1 gen 2011 anni
1.213 Mille.
+63.269
5.5%
1 gen 2012 anni
1.299 Mille.
+86.17
7.11%
1 gen 2013 anni
1.314 Mille.
+15.101
1.16%
1 gen 2014 anni
1.381 Mille.
+67.07
5.1%
1 gen 2015 anni
1.465 Mille.
+83.887
6.07%
Classificazione dei paesi secondo i statistiche attuali per anni