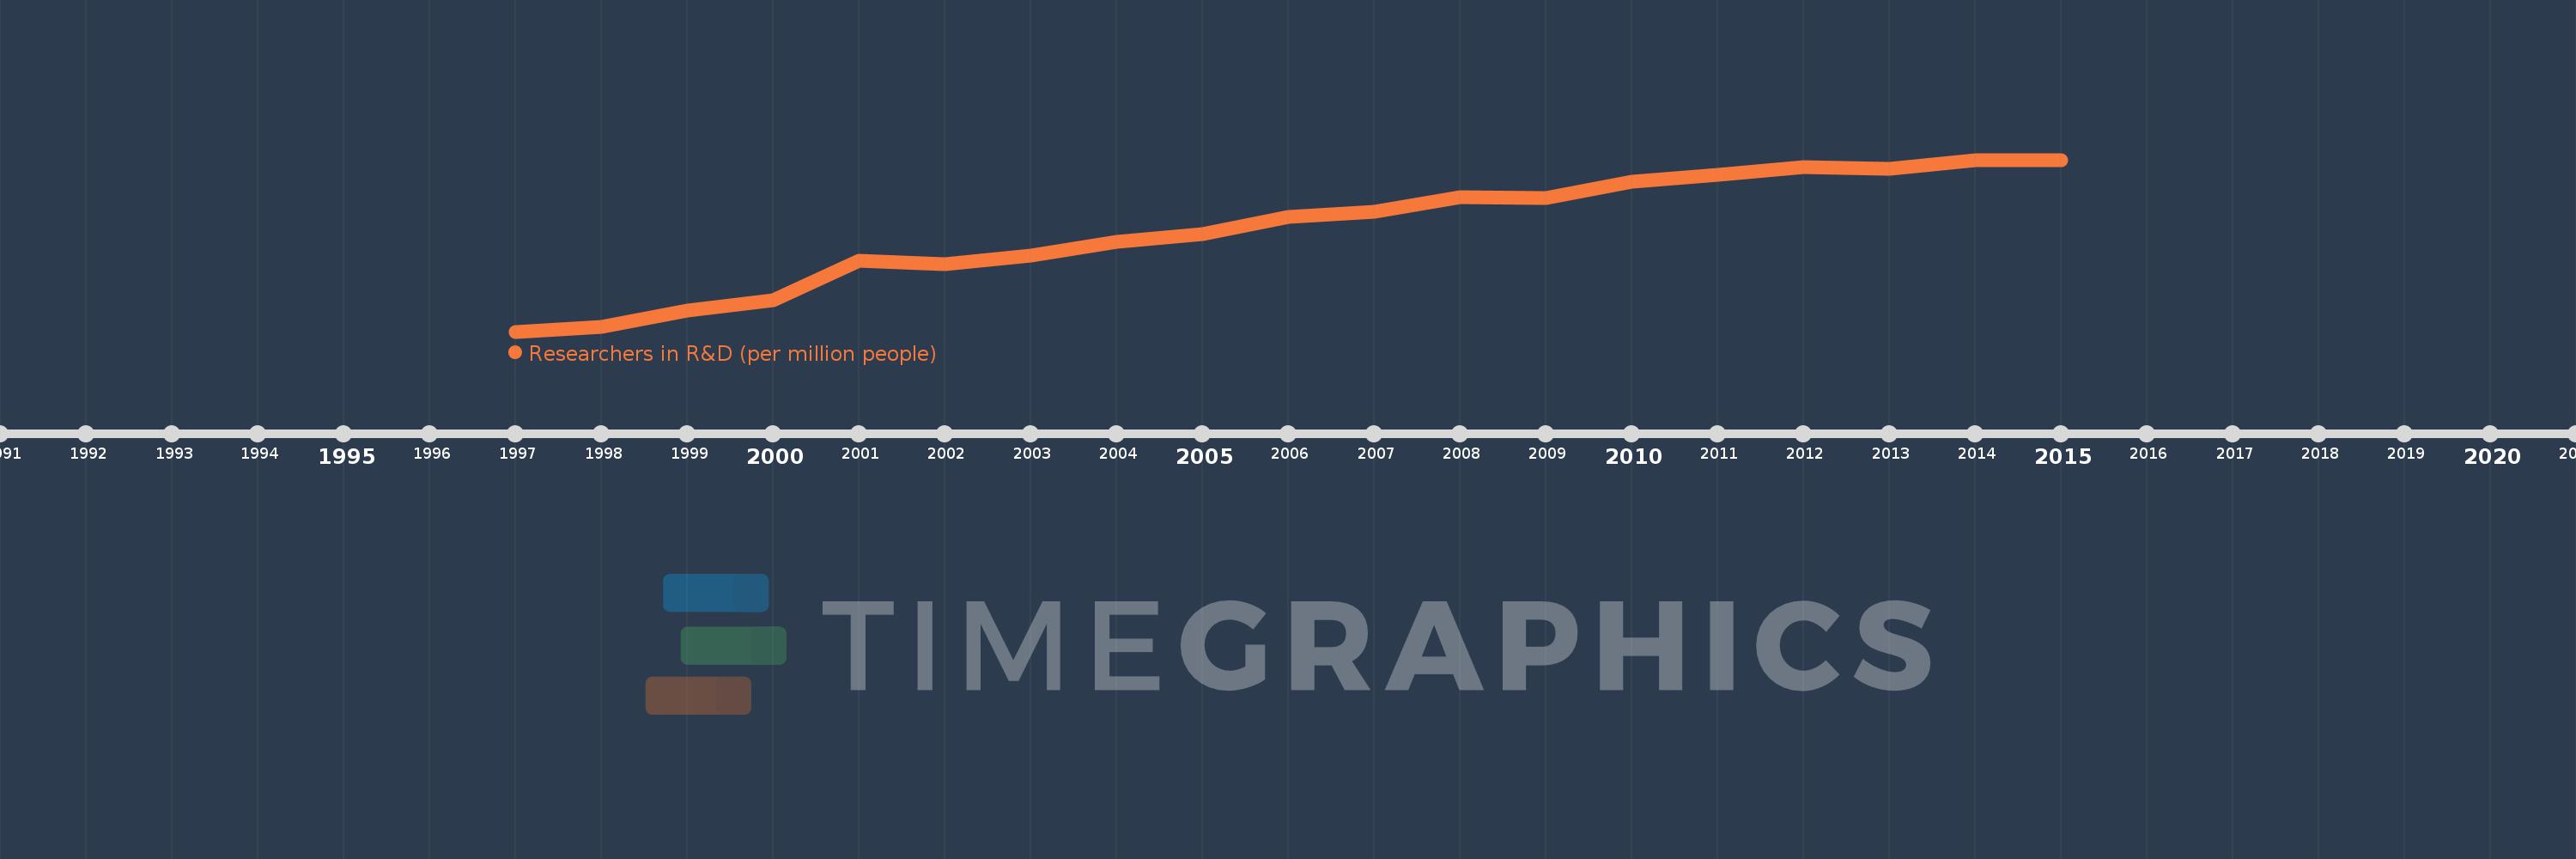
Questa scala temporale mostra un grafico dal 1997 anno al 2015 anno. Singapore. I dati fino ad 1996 anno non disponibili. Il numero di osservazioni attuali secondo i date: 19.
La fonte (nome):
Indicatori dello sviluppo mondiale
La fonte (organizzazione):
United Nations Educational, Scientific, and Cultural Organization (UNESCO) Institute for Statistics.
Categorie:
Science & Technology
sono stati aggiornati
23 apr 2017 anni
Indicatori delle variazioni dei valori per anni
In media:
4.993 Mille.
Minima:
2.551 Mille.
1 gen 1997 anni
Massimo:
6.665 Mille.
1 gen 2014 anni
Alla data di osservazione
Valore
Variazione assoluta
La variazione rispetto al valore precedente
1 gen 1997 anni
2.551 Mille.
+2.551 Mille.
0.0%
1 gen 1998 anni
2.656 Mille.
+105.161
4.12%
1 gen 1999 anni
3.051 Mille.
+394.367
14.85%
1 gen 2000 anni
3.296 Mille.
+245.025
8.03%
1 gen 2001 anni
4.245 Mille.
+949.275
28.8%
1 gen 2002 anni
4.161 Mille.
-84.098
-1.98%
1 gen 2003 anni
4.381 Mille.
+220.059
5.29%
1 gen 2004 anni
4.706 Mille.
+325.46
7.43%
1 gen 2005 anni
4.882 Mille.
+175.398
3.73%
1 gen 2006 anni
5.292 Mille.
+409.918
8.4%
1 gen 2007 anni
5.425 Mille.
+133.018
2.51%
1 gen 2008 anni
5.769 Mille.
+343.783
6.34%
1 gen 2009 anni
5.741 Mille.
-27.732
-0.48%
1 gen 2010 anni
6.149 Mille.
+408.124
7.11%
1 gen 2011 anni
6.307 Mille.
+157.558
2.56%
1 gen 2012 anni
6.496 Mille.
+189.468
3.0%
1 gen 2013 anni
6.442 Mille.
-53.711
-0.83%
1 gen 2014 anni
6.665 Mille.
+222.918
3.46%
1 gen 2015 anni
6.658 Mille.
-6.695
-0.1%
Classificazione dei paesi secondo i statistiche attuali per anni