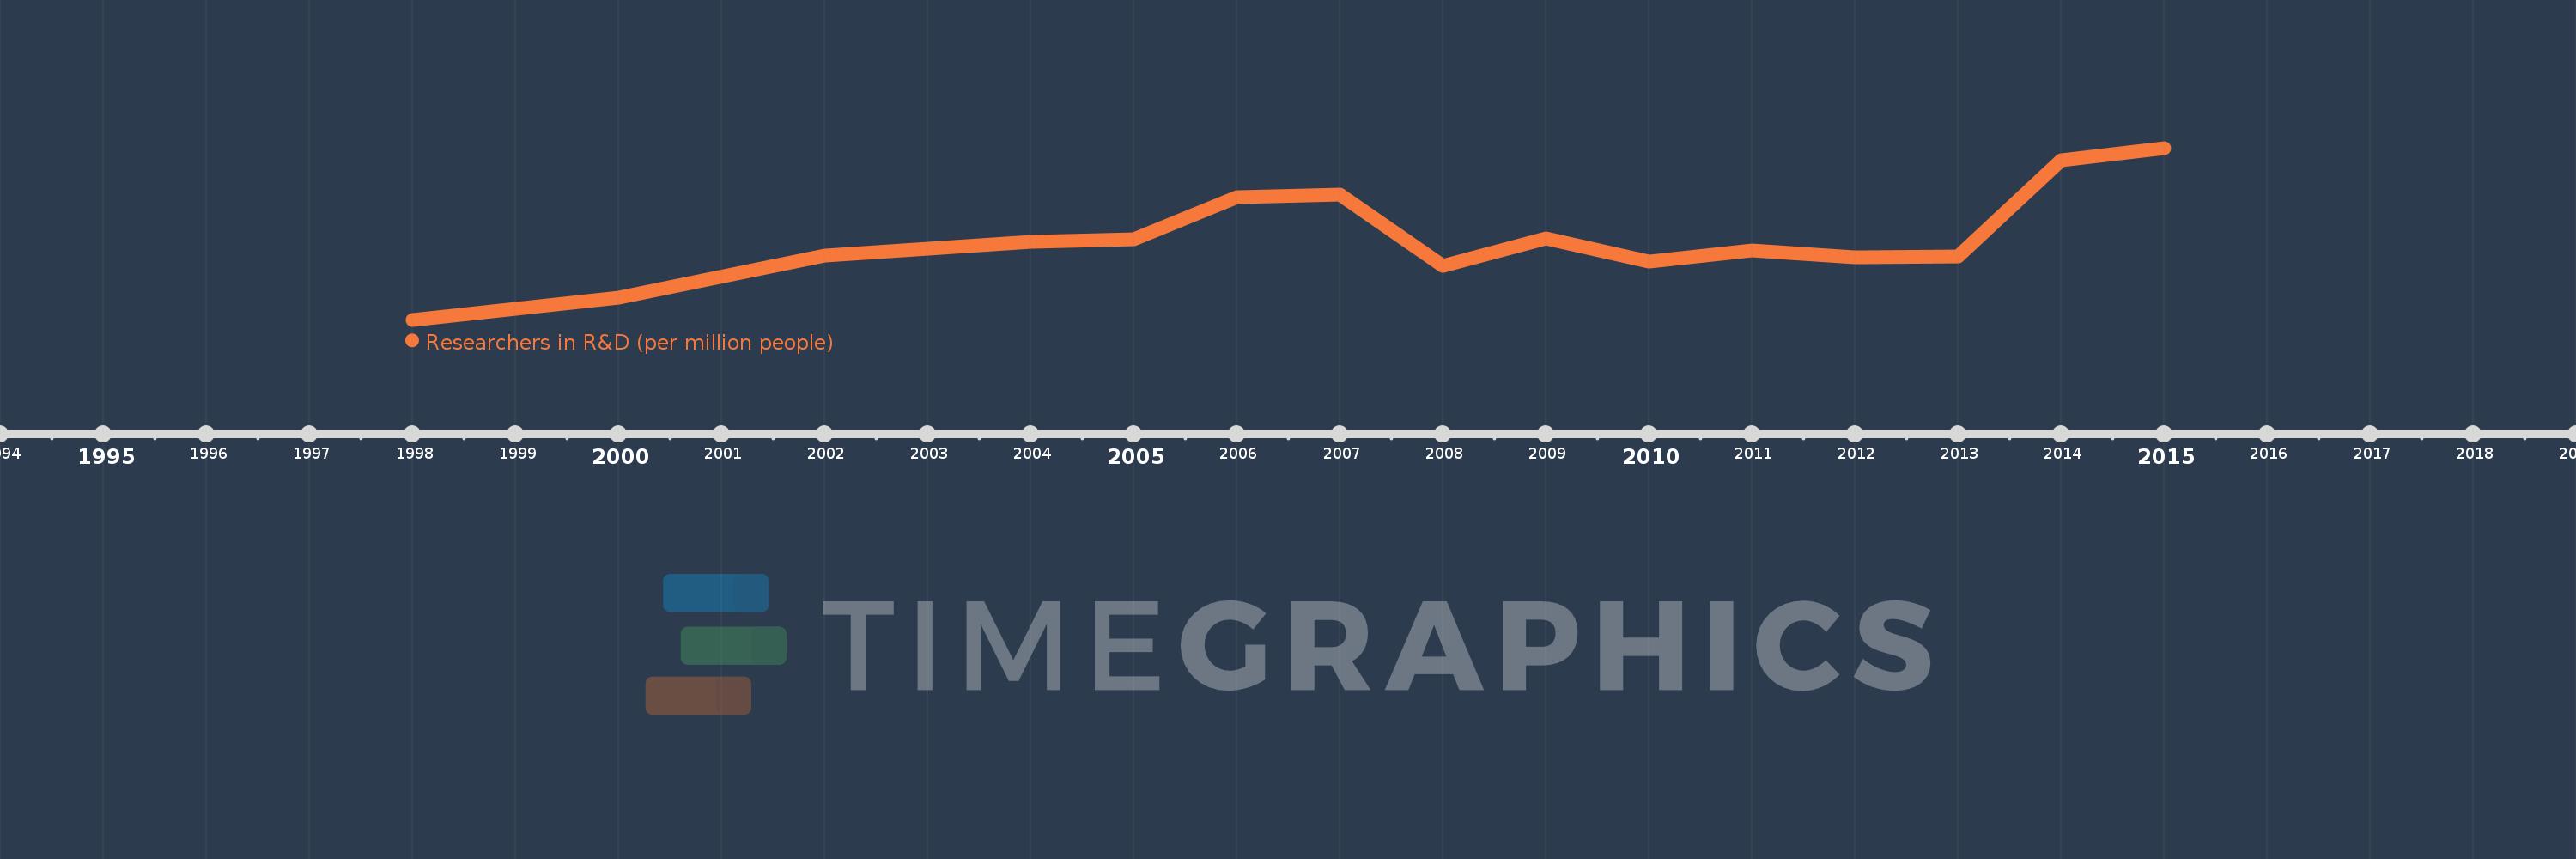
Questa scala temporale mostra un grafico dal 1998 anno al 2015 anno. Sweden. I dati fino ad 1997 anno non disponibili. Il numero di osservazioni attuali secondo i date: 15.
La fonte (nome):
Indicatori dello sviluppo mondiale
La fonte (organizzazione):
United Nations Educational, Scientific, and Cultural Organization (UNESCO) Institute for Statistics.
Categorie:
Science & Technology
sono stati aggiornati
23 apr 2017 anni
Indicatori delle variazioni dei valori per anni
In media:
5.435 Mille.
Minima:
4.163 Mille.
1 gen 1998 anni
Massimo:
6.868 Mille.
1 gen 2015 anni
Alla data di osservazione
Valore
Variazione assoluta
La variazione rispetto al valore precedente
1 gen 1998 anni
4.163 Mille.
+4.163 Mille.
0.0%
1 gen 2000 anni
4.504 Mille.
+341.181
8.2%
1 gen 2002 anni
5.175 Mille.
+670.701
14.89%
1 gen 2004 anni
5.388 Mille.
+213.565
4.13%
1 gen 2005 anni
5.431 Mille.
+42.967
0.8%
1 gen 2006 anni
6.091 Mille.
+659.672
12.15%
1 gen 2007 anni
6.133 Mille.
+41.849
0.69%
1 gen 2008 anni
5.005 Mille.
-1.128 Mille.
-18.39%
1 gen 2009 anni
5.443 Mille.
+438.154
8.75%
1 gen 2010 anni
5.085 Mille.
-358.11
-6.58%
1 gen 2011 anni
5.256 Mille.
+170.851
3.36%
1 gen 2012 anni
5.147 Mille.
-108.933
-2.07%
1 gen 2013 anni
5.164 Mille.
+16.824
0.33%
1 gen 2014 anni
6.67 Mille.
+1.506 Mille.
29.17%
1 gen 2015 anni
6.868 Mille.
+198.085
2.97%
Classificazione dei paesi secondo i statistiche attuali per anni