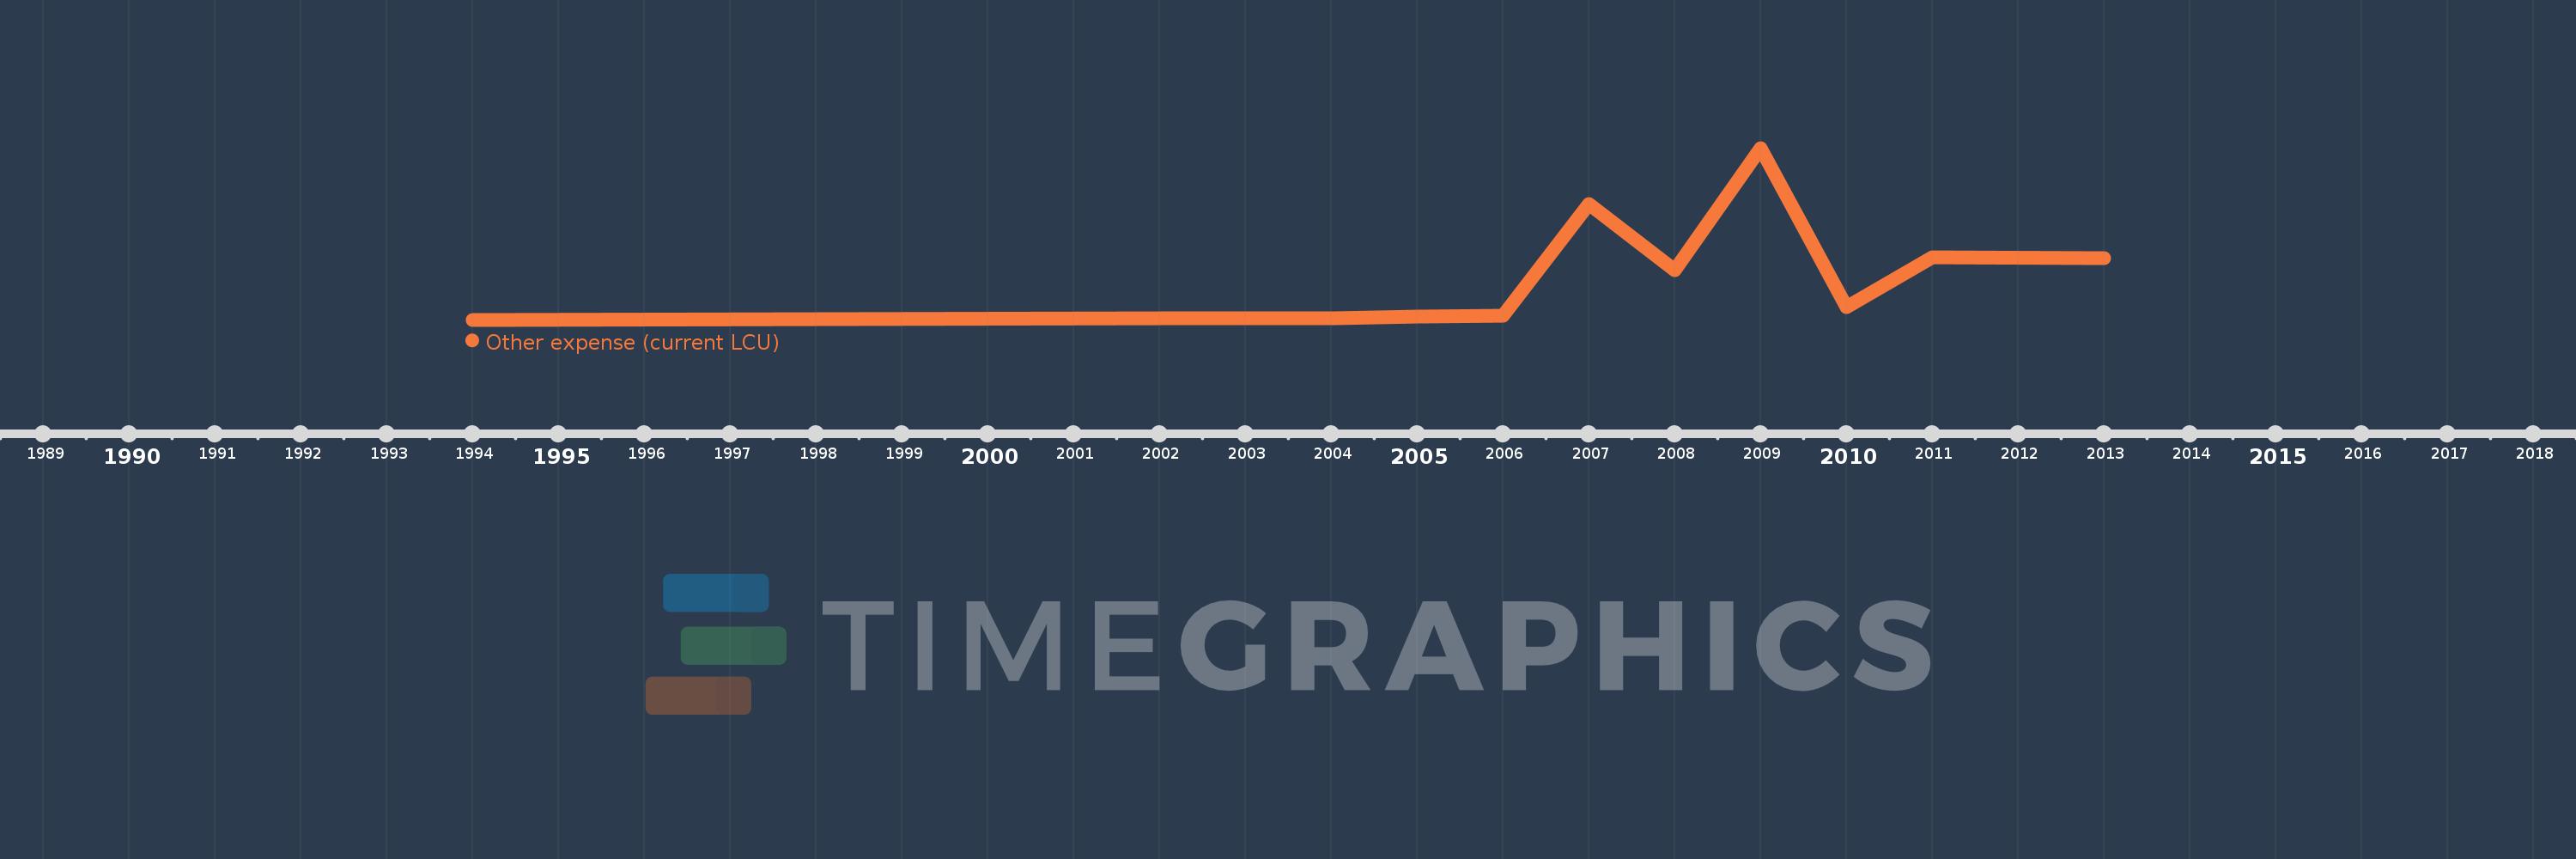
Questa scala temporale mostra un grafico dal 1994 anno al 2013 anno. Trinidad and Tobago. I dati fino ad 1993 anno non disponibili. Il numero di osservazioni attuali secondo i date: 12.
La fonte (nome):
Indicatori dello sviluppo mondiale
La fonte (organizzazione):
International Monetary Fund, Government Finance Statistics Yearbook and data files.
Categorie:
Public Sector
sono stati aggiornati
23 apr 2017 anni
Indicatori delle variazioni dei valori per anni
In media:
2.345 Mlrd
Minima:
95.4 Mln
1 gen 1994 anni
Massimo:
9.659 Mlrd
1 gen 2009 anni
Alla data di osservazione
Valore
Variazione assoluta
La variazione rispetto al valore precedente
1 gen 1994 anni
95.4 Mln
+95.4 Mln
0.0%
1 gen 2002 anni
171.3 Mln
+75.9 Mln
79.56%
1 gen 2003 anni
169.9 Mln
-1.4 Mln
-0.82%
1 gen 2004 anni
193.3 Mln
+23.4 Mln
13.77%
1 gen 2005 anni
271.2 Mln
+77.9 Mln
40.3%
1 gen 2006 anni
314.1 Mln
+42.9 Mln
15.82%
1 gen 2007 anni
6.528 Mlrd
+6.213 Mlrd
1.98 Mille.%
1 gen 2008 anni
2.833 Mlrd
-3.695 Mlrd
-56.61%
1 gen 2009 anni
9.659 Mlrd
+6.826 Mlrd
240.99%
1 gen 2010 anni
805.6 Mln
-8.853 Mlrd
-91.66%
1 gen 2011 anni
3.586 Mlrd
+2.781 Mlrd
345.16%
1 gen 2013 anni
3.517 Mlrd
-68.9 Mln
-1.92%
Classificazione dei paesi secondo i statistiche attuali per anni