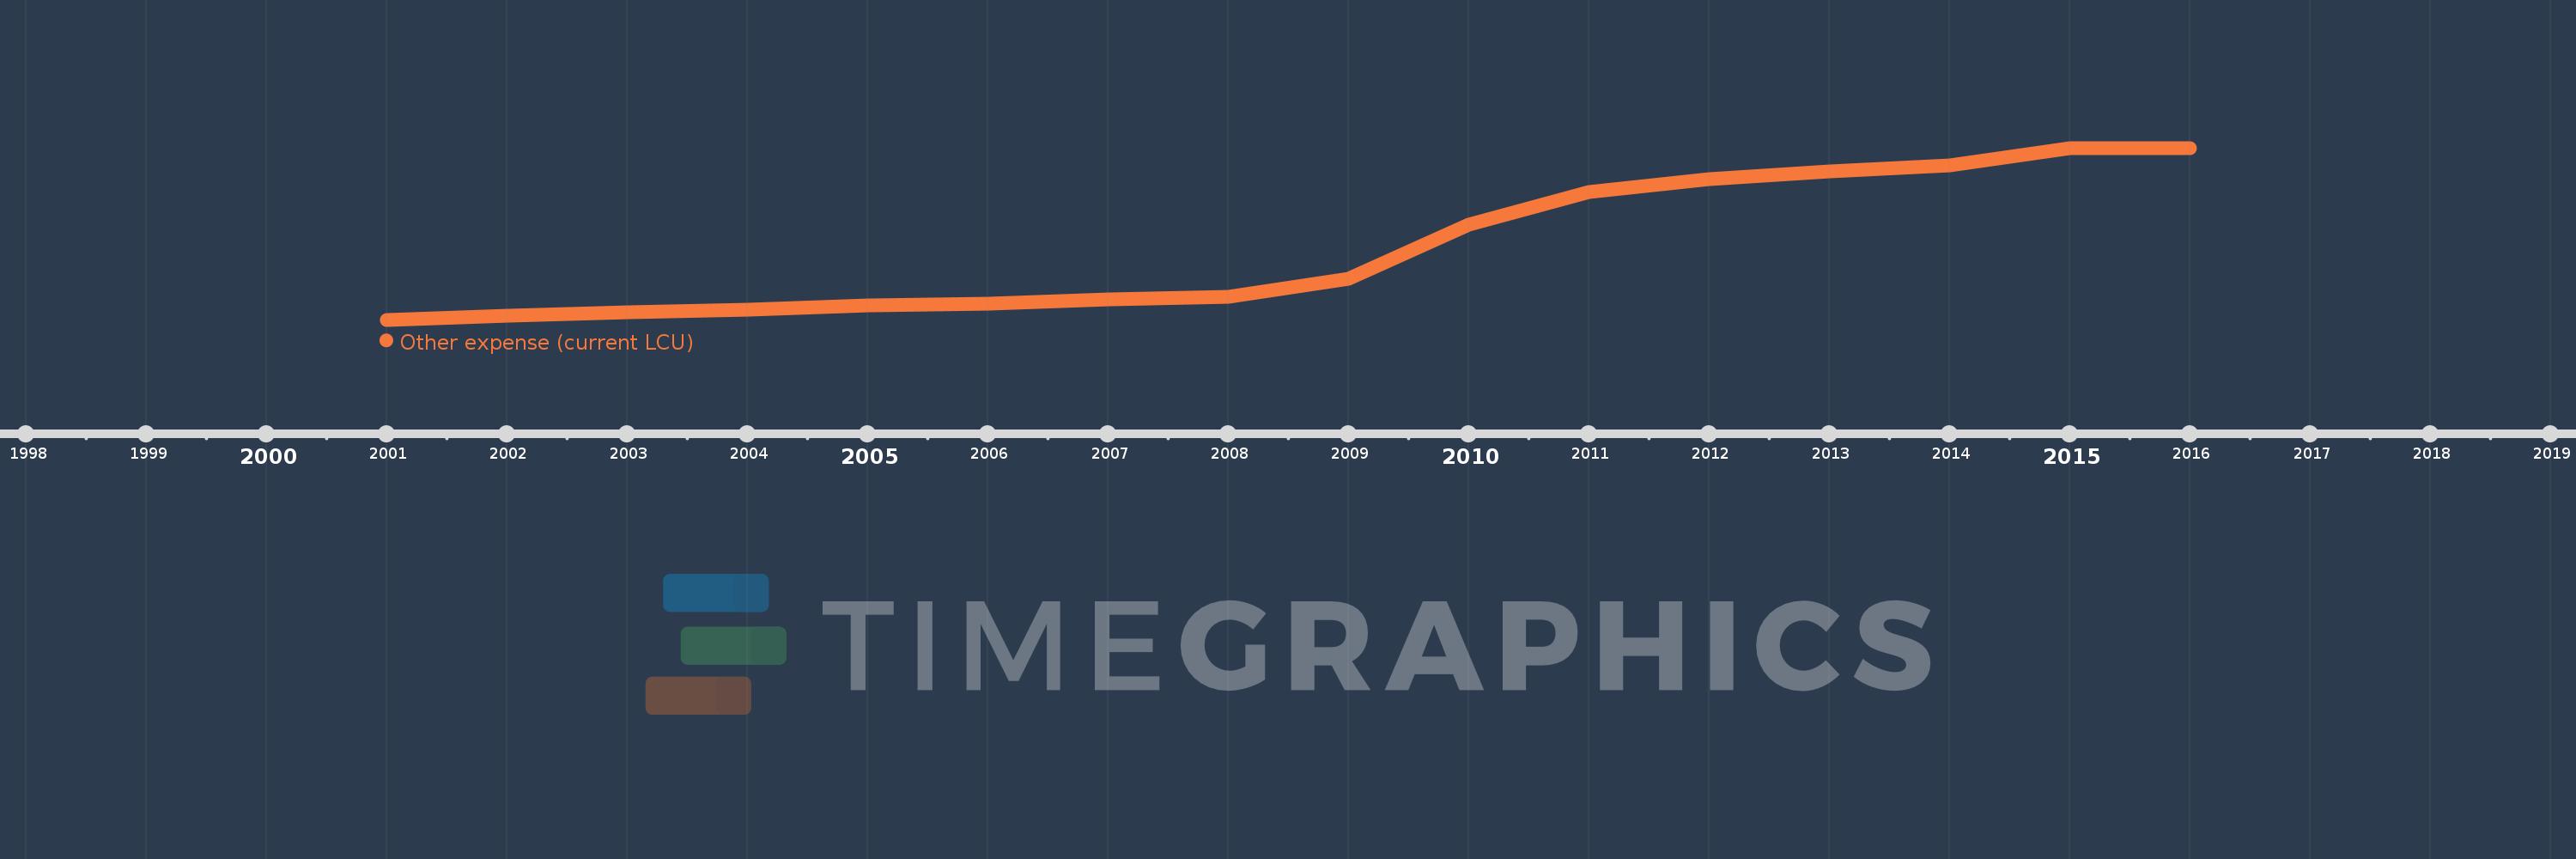
Questa scala temporale mostra un grafico dal 2001 anno al 2016 anno. Chile. I dati fino ad 2000 anno non disponibili. Il numero di osservazioni attuali secondo i date: 16.
La fonte (nome):
Indicatori dello sviluppo mondiale
La fonte (organizzazione):
International Monetary Fund, Government Finance Statistics Yearbook and data files.
Categorie:
Public Sector
sono stati aggiornati
23 apr 2017 anni
Indicatori delle variazioni dei valori per anni
In media:
3.213 Trln
Minima:
812.93 Mlrd
1 gen 2001 anni
Massimo:
6.577 Trln
1 gen 2015 anni
Alla data di osservazione
Valore
Variazione assoluta
La variazione rispetto al valore precedente
1 gen 2001 anni
812.93 Mlrd
+812.93 Mlrd
0.0%
1 gen 2002 anni
942.88 Mlrd
+129.95 Mlrd
15.99%
1 gen 2003 anni
1.055 Trln
+112.28 Mlrd
11.91%
1 gen 2004 anni
1.149 Trln
+93.93 Mlrd
8.9%
1 gen 2005 anni
1.284 Trln
+134.85 Mlrd
11.74%
1 gen 2006 anni
1.347 Trln
+63.06 Mlrd
4.91%
1 gen 2007 anni
1.495 Trln
+148.0 Mlrd
10.99%
1 gen 2008 anni
1.594 Trln
+99.216 Mlrd
6.64%
1 gen 2009 anni
2.195 Trln
+601.026 Mlrd
37.7%
1 gen 2010 anni
3.994 Trln
+1.798 Trln
81.92%
1 gen 2011 anni
5.087 Trln
+1.093 Trln
27.38%
1 gen 2012 anni
5.524 Trln
+437.19 Mlrd
8.59%
1 gen 2013 anni
5.784 Trln
+260.158 Mlrd
4.71%
1 gen 2014 anni
5.994 Trln
+209.448 Mlrd
3.62%
1 gen 2015 anni
6.577 Trln
+583.449 Mlrd
9.73%
1 gen 2016 anni
6.566 Trln
-11.303 Mlrd
-0.17%
Classificazione dei paesi secondo i statistiche attuali per anni