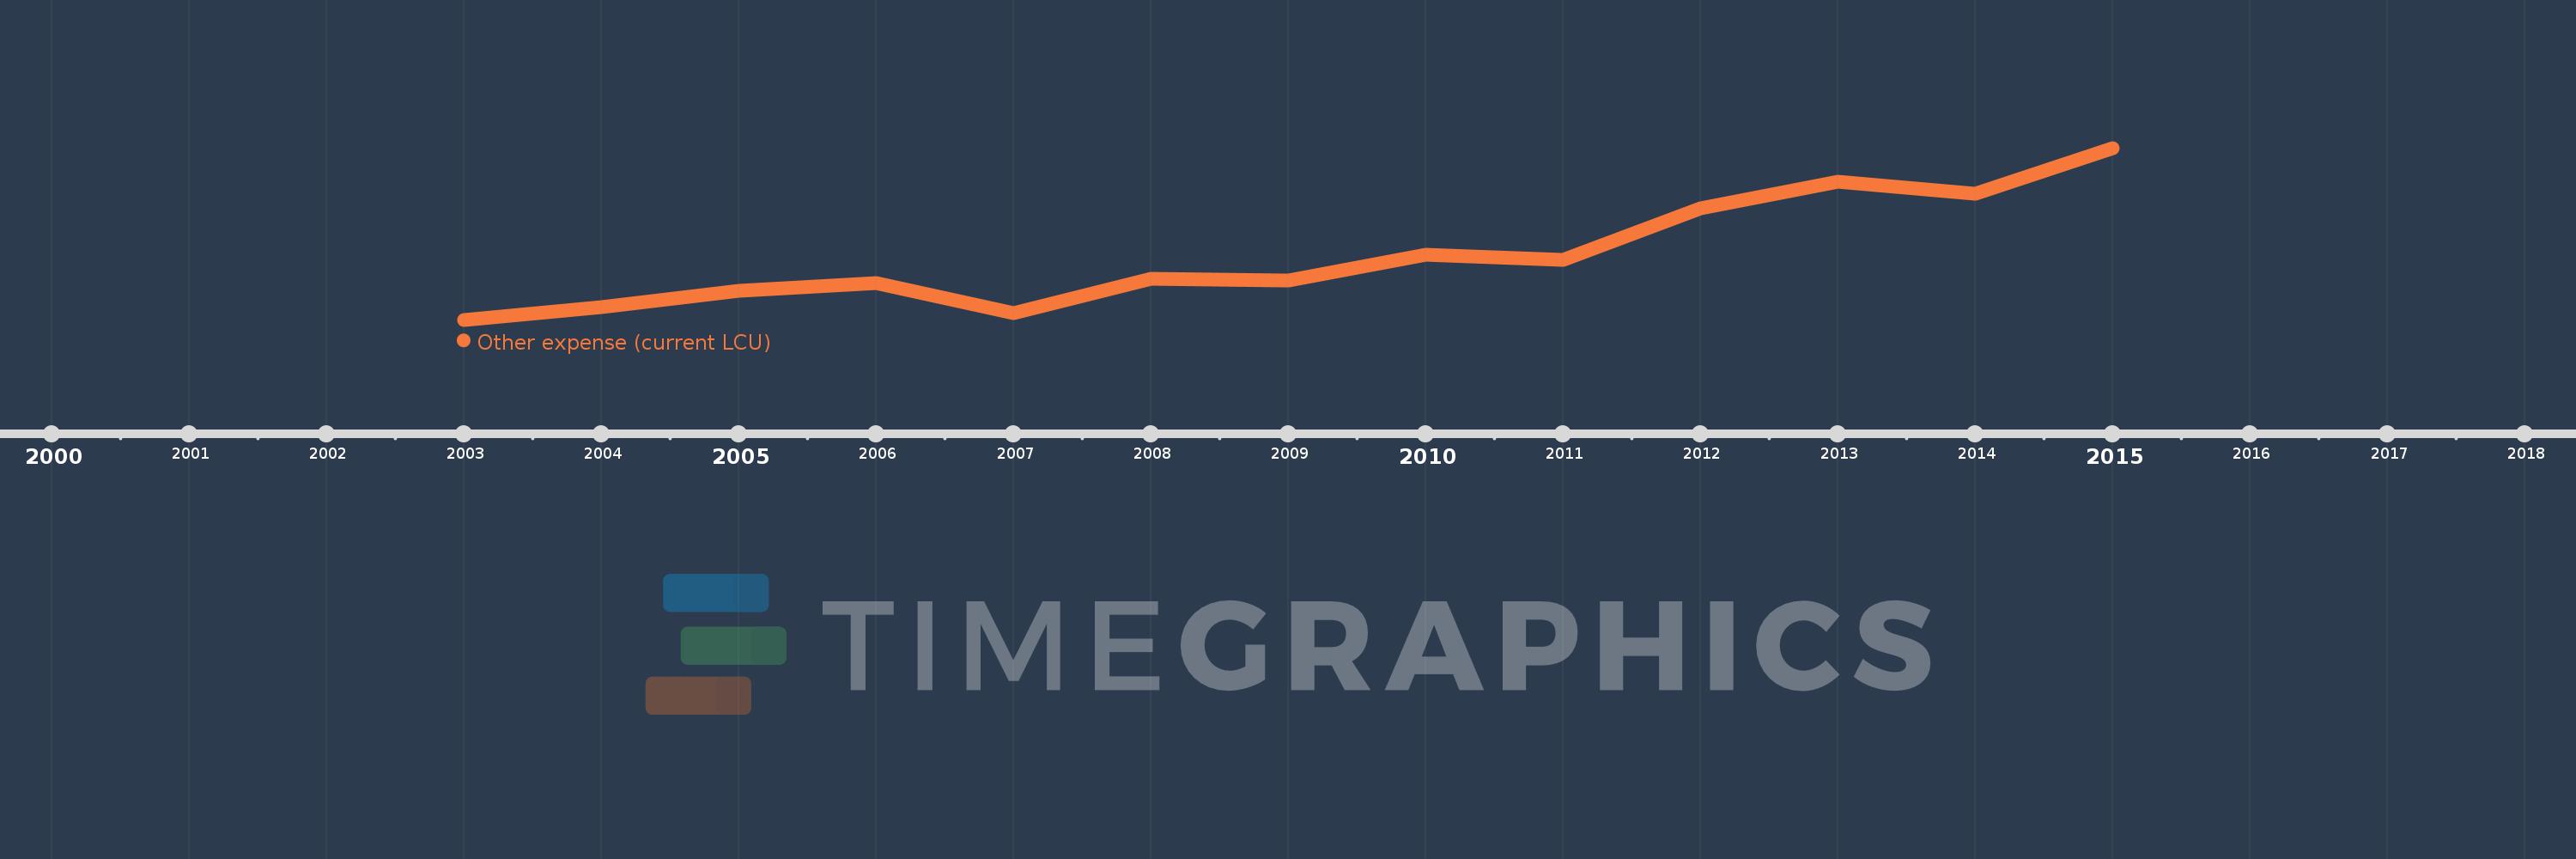
Questa scala temporale mostra un grafico dal 2003 anno al 2015 anno. Egypt, Arab Rep.. I dati fino ad 2002 anno non disponibili. Il numero di osservazioni attuali secondo i date: 13.
La fonte (nome):
Indicatori dello sviluppo mondiale
La fonte (organizzazione):
International Monetary Fund, Government Finance Statistics Yearbook and data files.
Categorie:
Public Sector
sono stati aggiornati
23 apr 2017 anni
Indicatori delle variazioni dei valori per anni
In media:
27.198 Mlrd
Minima:
18.885 Mlrd
1 gen 2003 anni
Massimo:
41.067 Mlrd
1 gen 2015 anni
Alla data di osservazione
Valore
Variazione assoluta
La variazione rispetto al valore precedente
1 gen 2003 anni
18.885 Mlrd
+18.885 Mlrd
0.0%
1 gen 2004 anni
20.534 Mlrd
+1.649 Mlrd
8.73%
1 gen 2005 anni
22.631 Mlrd
+2.097 Mlrd
10.21%
1 gen 2006 anni
23.583 Mlrd
+952.0 Mln
4.21%
1 gen 2007 anni
19.762 Mlrd
-3.821 Mlrd
-16.2%
1 gen 2008 anni
24.132 Mlrd
+4.37 Mlrd
22.11%
1 gen 2009 anni
23.973 Mlrd
-158.9 Mln
-0.66%
1 gen 2010 anni
27.276 Mlrd
+3.304 Mlrd
13.78%
1 gen 2011 anni
26.647 Mlrd
-628.9 Mln
-2.31%
1 gen 2012 anni
33.233 Mlrd
+6.586 Mlrd
24.72%
1 gen 2013 anni
36.716 Mlrd
+3.482 Mlrd
10.48%
1 gen 2014 anni
35.141 Mlrd
-1.575 Mlrd
-4.29%
1 gen 2015 anni
41.067 Mlrd
+5.926 Mlrd
16.86%
Classificazione dei paesi secondo i statistiche attuali per anni