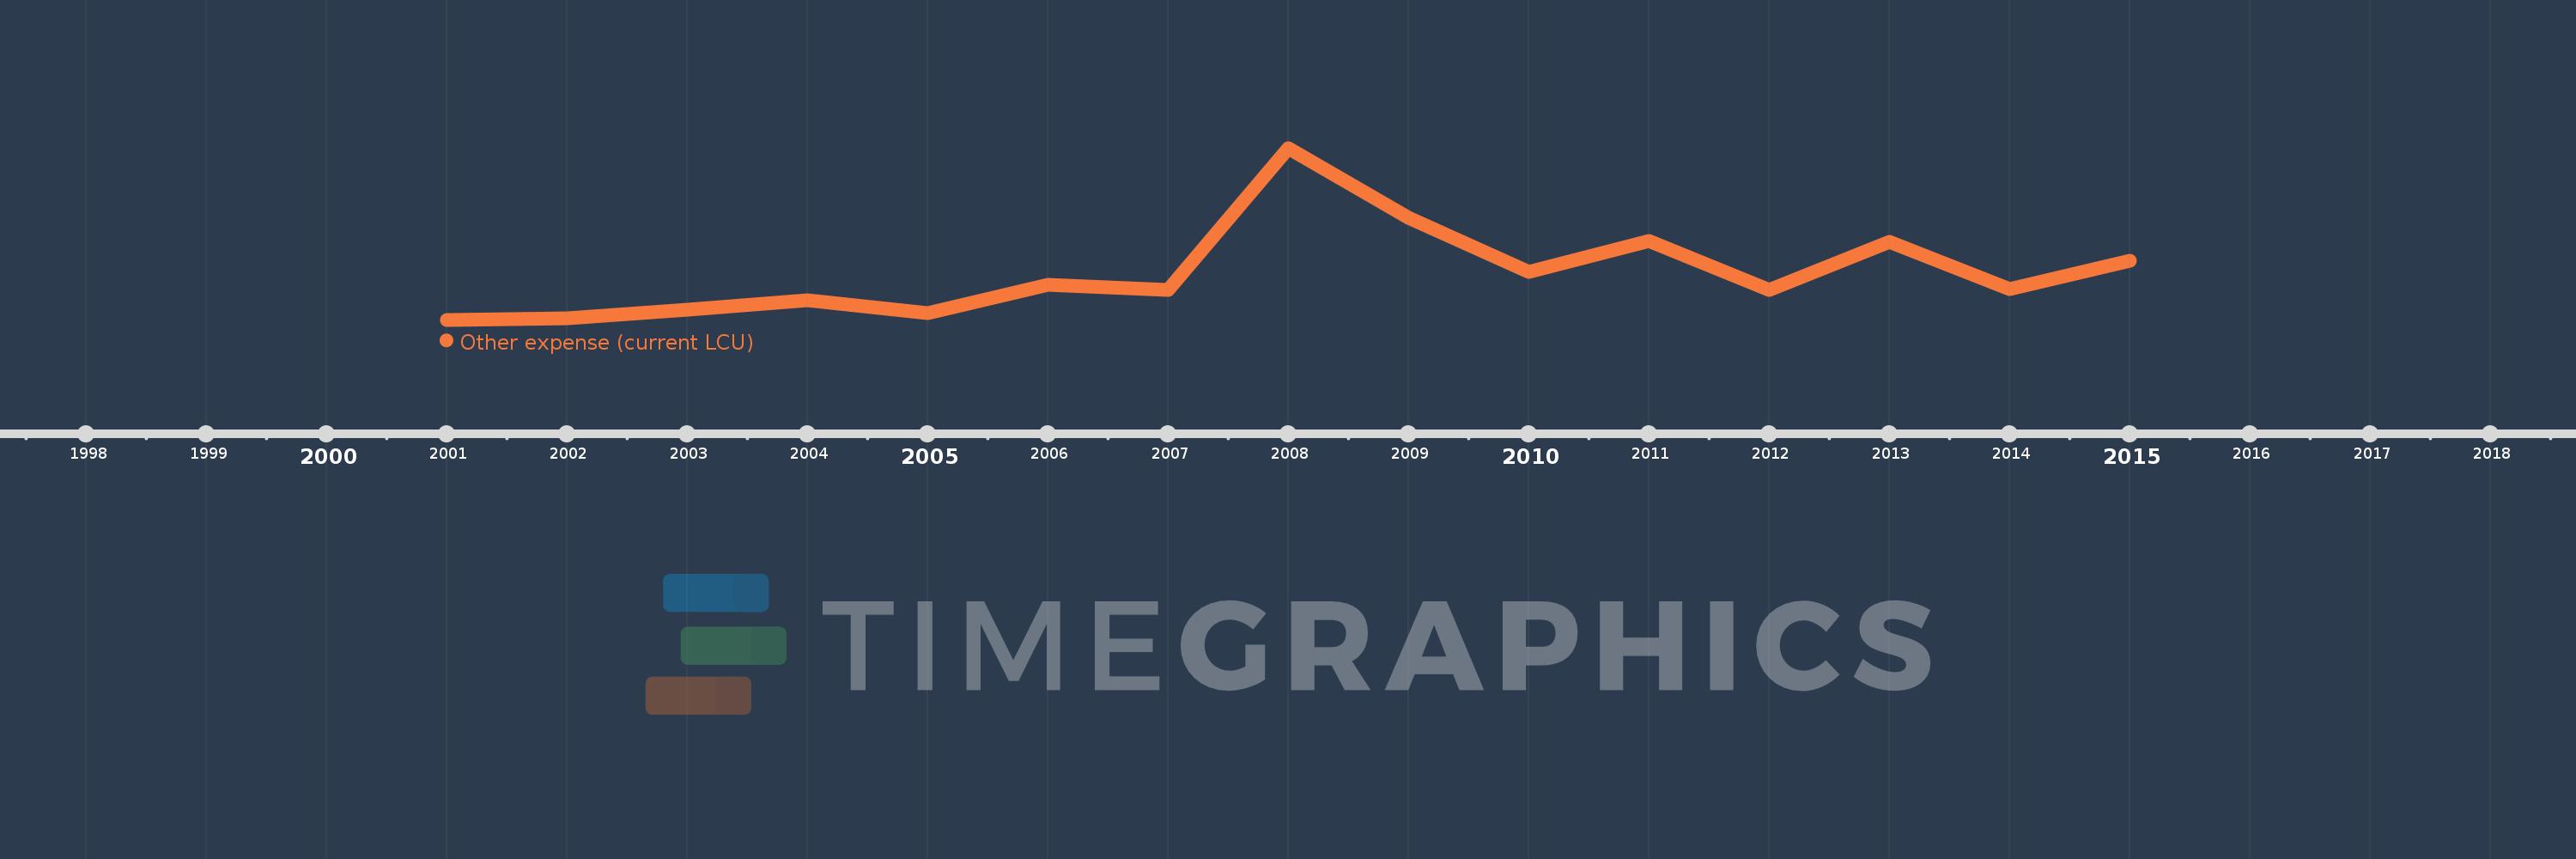
Questa scala temporale mostra un grafico dal 2001 anno al 2015 anno. Philippines. I dati fino ad 2000 anno non disponibili. Il numero di osservazioni attuali secondo i date: 15.
La fonte (nome):
Indicatori dello sviluppo mondiale
La fonte (organizzazione):
International Monetary Fund, Government Finance Statistics Yearbook and data files.
Categorie:
Public Sector
sono stati aggiornati
23 apr 2017 anni
Indicatori delle variazioni dei valori per anni
In media:
26.255 Mlrd
Minima:
3.6 Mlrd
1 gen 2001 anni
Massimo:
86.957 Mlrd
1 gen 2008 anni
Alla data di osservazione
Valore
Variazione assoluta
La variazione rispetto al valore precedente
1 gen 2001 anni
3.6 Mlrd
+3.6 Mlrd
0.0%
1 gen 2002 anni
4.25 Mlrd
+650.0 Mln
18.06%
1 gen 2003 anni
8.3 Mlrd
+4.05 Mlrd
95.29%
1 gen 2004 anni
13.11 Mlrd
+4.81 Mlrd
57.95%
1 gen 2005 anni
6.95 Mlrd
-6.16 Mlrd
-46.99%
1 gen 2006 anni
20.4 Mlrd
+13.45 Mlrd
193.53%
1 gen 2007 anni
18.2 Mlrd
-2.2 Mlrd
-10.78%
1 gen 2008 anni
86.957 Mlrd
+68.757 Mlrd
377.79%
1 gen 2009 anni
53.035 Mlrd
-33.922 Mlrd
-39.01%
1 gen 2010 anni
26.918 Mlrd
-26.117 Mlrd
-49.24%
1 gen 2011 anni
41.637 Mlrd
+14.719 Mlrd
54.68%
1 gen 2012 anni
18.224 Mlrd
-23.413 Mlrd
-56.23%
1 gen 2013 anni
41.366 Mlrd
+23.142 Mlrd
126.99%
1 gen 2014 anni
18.583 Mlrd
-22.783 Mlrd
-55.08%
1 gen 2015 anni
32.3 Mlrd
+13.717 Mlrd
73.81%
Classificazione dei paesi secondo i statistiche attuali per anni