33
/it/
AIzaSyAYiBZKx7MnpbEhh9jyipgxe19OcubqV5w
August 1, 2025
264960
Togo
TGO
true
2
1
Net financial flows, IBRD (NFL, current US$)
1992,1991,1990,1989,1988,1987,1986,1985,1984,1983,1982,1979
Download
Biblioteca di statistiche globali →Togo →

Net financial flows, IBRD (NFL, current US$)

Queste statistiche in altri paesi:

AlbaniaAlgeriaAngolaArgentinaArmeniaAzerbaijanBangladeshBelarusBelizeBoliviaBosnia and HerzegovinaBotswanaBrazilBulgariaBurundiCabo VerdeCameroonCaribbean small statesCentral Europe and the BalticsChadChinaColombiaCongo, Dem. Rep.Congo, Rep.Costa RicaCote d'IvoireCroatiaCzech RepublicDominicaDominican RepublicEarly-demographic dividendEast Asia & PacificEast Asia & Pacific (excluding high income)East Asia & Pacific (IDA & IBRD countries)EcuadorEgypt, Arab Rep.El SalvadorEquatorial GuineaEstoniaEthiopiaEurope & Central AsiaEurope & Central Asia (excluding high income)Europe & Central Asia (IDA & IBRD countries)FijiFragile and conflict affected situationsGabonGeorgiaGhanaGreeceGrenadaGuatemalaGuineaGuyanaHondurasHungaryIBRD onlyIDA & IBRD totalIDA blendIDA onlyIDA totalIndiaIndonesiaIran, Islamic Rep.JamaicaJordanKazakhstanKenyaKorea, Rep.KosovoLate-demographic dividendLatin America & Caribbean Latin America & Caribbean (excluding high income)Latin America & the Caribbean (IDA & IBRD countries)LebanonLesothoLiberiaLow & middle incomeLow incomeLower middle incomeMacedonia, FYRMadagascarMalawiMalaysiaMauritaniaMauritiusMexicoMiddle East & North AfricaMiddle East & North Africa (excluding high income)Middle East & North Africa (IDA & IBRD countries)Middle incomeMoldovaMontenegroMoroccoMyanmarNicaraguaNigeriaOmanOther small statesPacific island small statesPakistanPanamaPapua New GuineaParaguayPeruPhilippinesPolandPre-demographic dividendRomaniaRussian FederationSenegalSerbiaSeychellesSierra LeoneSlovak RepublicSloveniaSmall statesSouth AfricaSouth AsiaSouth Asia (IDA & IBRD)Sri LankaSt. Kitts and NevisSt. LuciaSt. Vincent and the GrenadinesSub-Saharan Africa Sub-Saharan Africa (excluding high income)Sub-Saharan Africa (IDA & IBRD countries)SudanSwazilandSyrian Arab RepublicTanzaniaThailandTogoTrinidad and TobagoTunisiaTurkeyTurkmenistanUgandaUkraineUpper middle incomeUzbekistanVenezuela, RBVietnamZambiaZimbabwe

Linea del tempo:

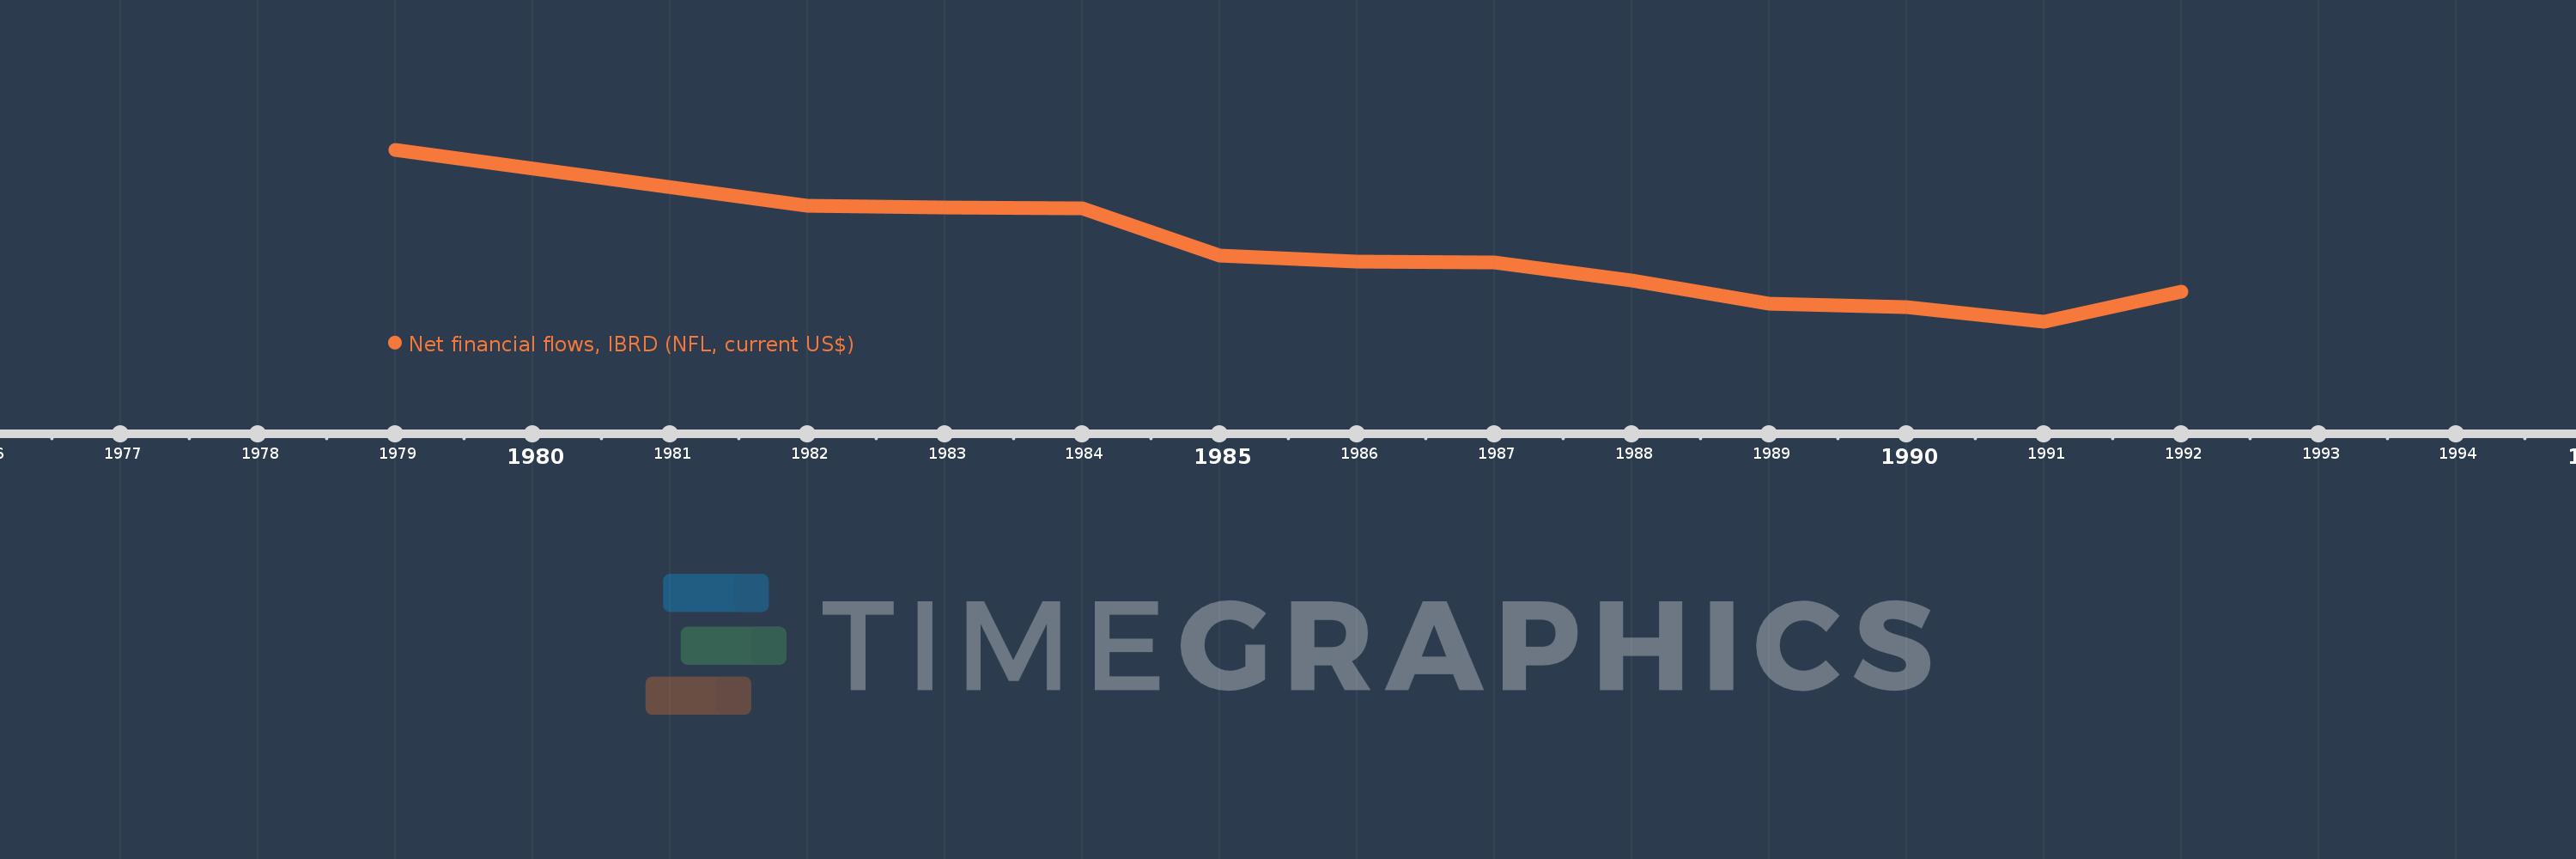
Questa scala temporale mostra un grafico dal 1979 anno al 1992 anno. Togo. I dati fino ad 1978 anno non disponibili. Il numero di osservazioni attuali secondo i date: 12.

La fonte (nome):

Indicatori dello sviluppo mondiale

La fonte (organizzazione):

World Bank, International Debt Statistics.

Categorie:

External Debt

sono stati aggiornati

23 apr 2017 anni

Indicatori delle variazioni dei valori per anni

In media:
-3.29 Mln
Minima:
-7.656 Mln
1 gen 1991 anni
Massimo:
3.5 Mln
1 gen 1979 anni
Alla data di osservazione
Valore
Variazione assoluta
La variazione rispetto al valore precedente
1 gen 1979 anni
3.5 Mln
+3.5 Mln
0.0%
1 gen 1982 anni
-110.0 Mille.
-3.61 Mln
-103.14%
1 gen 1983 anni
-240.0 Mille.
-130.0 Mille.
118.18%
1 gen 1984 anni
-260.0 Mille.
-20.0 Mille.
8.33%
1 gen 1985 anni
-3.358 Mln
-3.098 Mln
1.19 Mille.%
1 gen 1986 anni
-3.753 Mln
-395.0 Mille.
11.76%
1 gen 1987 anni
-3.778 Mln
-25.0 Mille.
0.67%
1 gen 1988 anni
-4.962 Mln
-1.184 Mln
31.34%
1 gen 1989 anni
-6.475 Mln
-1.513 Mln
30.49%
1 gen 1990 anni
-6.698 Mln
-223.0 Mille.
3.44%
1 gen 1991 anni
-7.656 Mln
-958.0 Mille.
14.3%
1 gen 1992 anni
-5.686 Mln
+1.97 Mln
-25.73%

Classificazione dei paesi secondo i statistiche attuali per anni