33
/it/
AIzaSyAYiBZKx7MnpbEhh9jyipgxe19OcubqV5w
August 1, 2025
146017
Guinea
GIN
true
2
1
Net financial flows, IBRD (NFL, current US$)
1993,1992,1991,1990,1989,1988,1987,1986,1985,1984,1983,1982,1981,1980,1979,1978,1977,1976,1975,1974,1973,1972,1971
Download
Biblioteca di statistiche globali →Guinea →

Net financial flows, IBRD (NFL, current US$)

Queste statistiche in altri paesi:

AlbaniaAlgeriaAngolaArgentinaArmeniaAzerbaijanBangladeshBelarusBelizeBoliviaBosnia and HerzegovinaBotswanaBrazilBulgariaBurundiCabo VerdeCameroonCaribbean small statesCentral Europe and the BalticsChadChinaColombiaCongo, Dem. Rep.Congo, Rep.Costa RicaCote d'IvoireCroatiaCzech RepublicDominicaDominican RepublicEarly-demographic dividendEast Asia & PacificEast Asia & Pacific (excluding high income)East Asia & Pacific (IDA & IBRD countries)EcuadorEgypt, Arab Rep.El SalvadorEquatorial GuineaEstoniaEthiopiaEurope & Central AsiaEurope & Central Asia (excluding high income)Europe & Central Asia (IDA & IBRD countries)FijiFragile and conflict affected situationsGabonGeorgiaGhanaGreeceGrenadaGuatemalaGuineaGuyanaHondurasHungaryIBRD onlyIDA & IBRD totalIDA blendIDA onlyIDA totalIndiaIndonesiaIran, Islamic Rep.JamaicaJordanKazakhstanKenyaKorea, Rep.KosovoLate-demographic dividendLatin America & Caribbean Latin America & Caribbean (excluding high income)Latin America & the Caribbean (IDA & IBRD countries)LebanonLesothoLiberiaLow & middle incomeLow incomeLower middle incomeMacedonia, FYRMadagascarMalawiMalaysiaMauritaniaMauritiusMexicoMiddle East & North AfricaMiddle East & North Africa (excluding high income)Middle East & North Africa (IDA & IBRD countries)Middle incomeMoldovaMontenegroMoroccoMyanmarNicaraguaNigeriaOmanOther small statesPacific island small statesPakistanPanamaPapua New GuineaParaguayPeruPhilippinesPolandPre-demographic dividendRomaniaRussian FederationSenegalSerbiaSeychellesSierra LeoneSlovak RepublicSloveniaSmall statesSouth AfricaSouth AsiaSouth Asia (IDA & IBRD)Sri LankaSt. Kitts and NevisSt. LuciaSt. Vincent and the GrenadinesSub-Saharan Africa Sub-Saharan Africa (excluding high income)Sub-Saharan Africa (IDA & IBRD countries)SudanSwazilandSyrian Arab RepublicTanzaniaThailandTogoTrinidad and TobagoTunisiaTurkeyTurkmenistanUgandaUkraineUpper middle incomeUzbekistanVenezuela, RBVietnamZambiaZimbabwe

Linea del tempo:

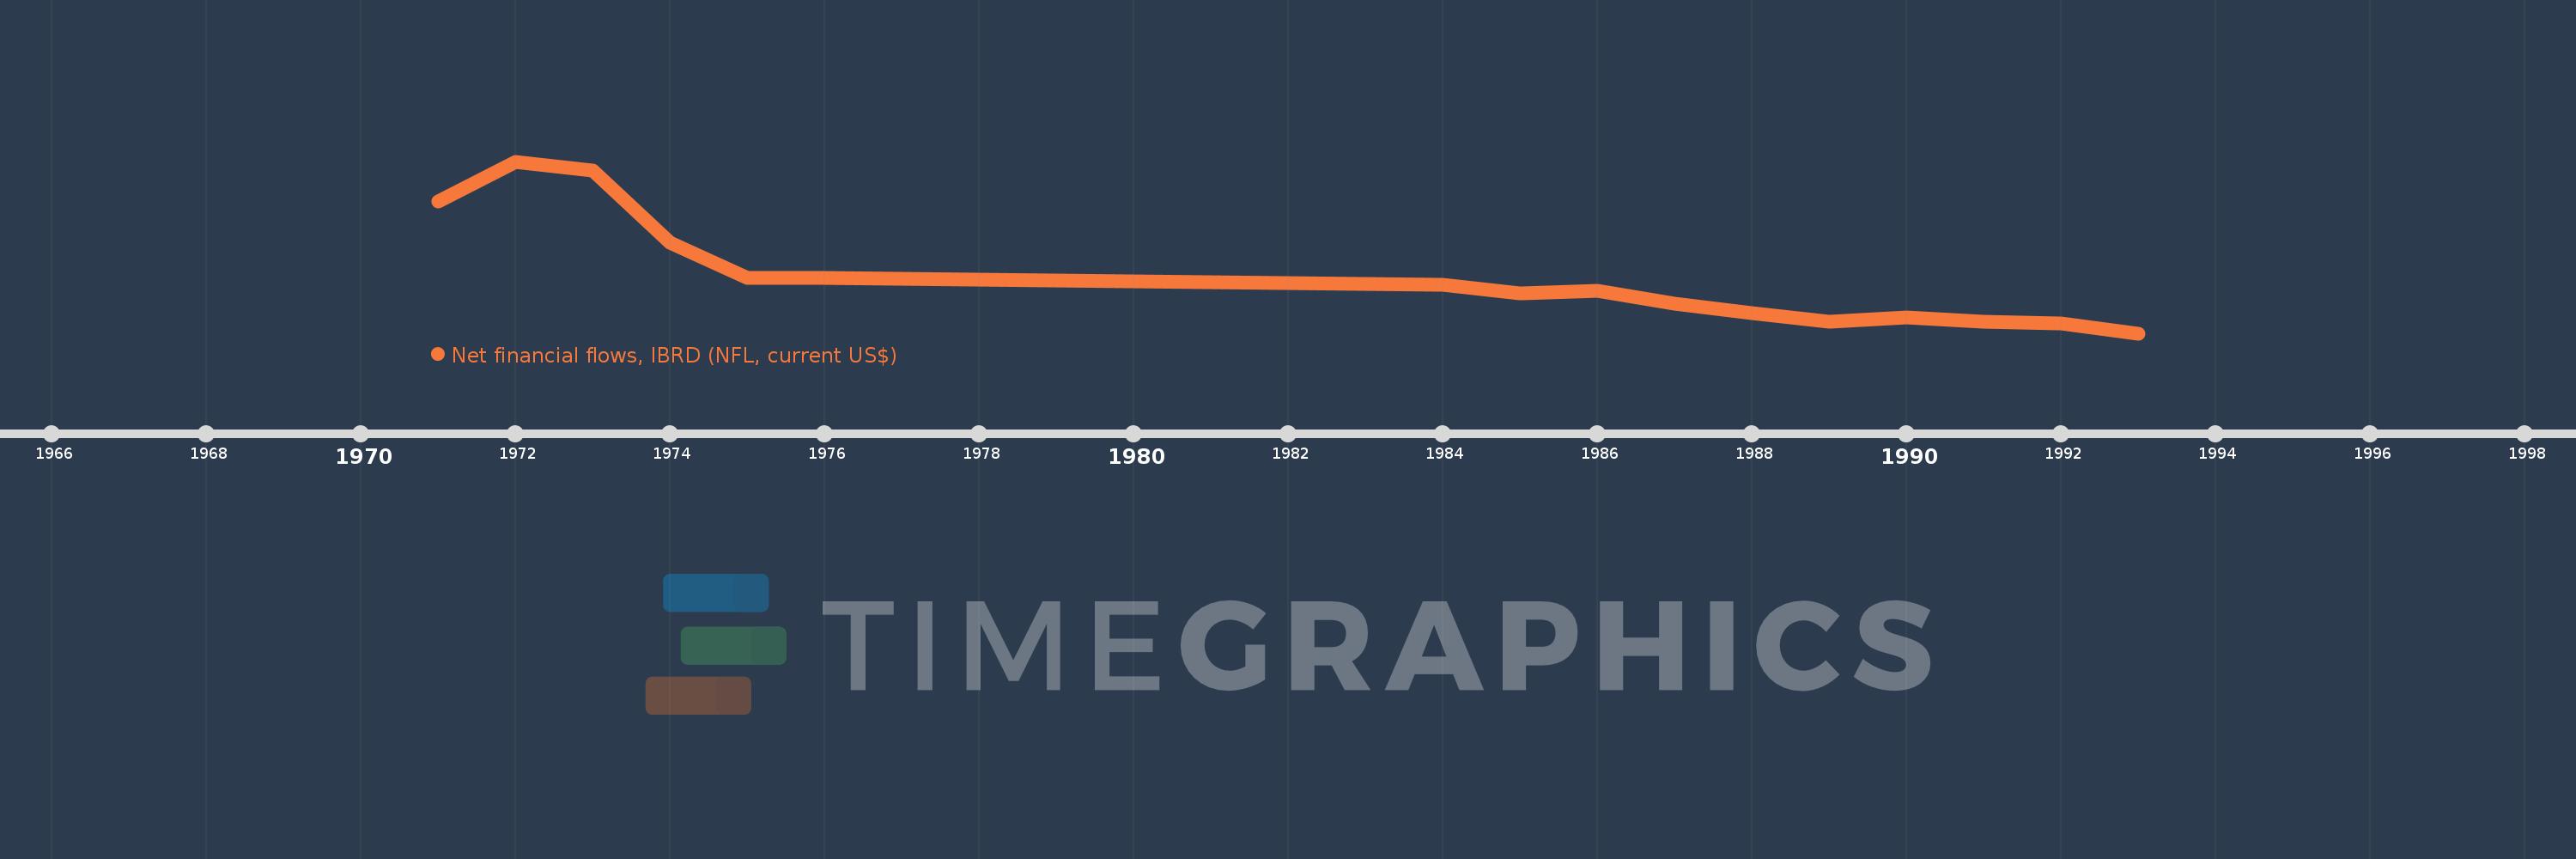
Questa scala temporale mostra un grafico dal 1971 anno al 1993 anno. Guinea. I dati fino ad 1970 anno non disponibili. Il numero di osservazioni attuali secondo i date: 23.

La fonte (nome):

Indicatori dello sviluppo mondiale

La fonte (organizzazione):

World Bank, International Debt Statistics.

Categorie:

External Debt

sono stati aggiornati

23 apr 2017 anni

Indicatori delle variazioni dei valori per anni

In media:
-2.178 Mln
Minima:
-14.565 Mln
1 gen 1993 anni
Massimo:
24.159 Mln
1 gen 1972 anni
Alla data di osservazione
Valore
Variazione assoluta
La variazione rispetto al valore precedente
1 gen 1971 anni
15.236 Mln
+15.236 Mln
0.0%
1 gen 1972 anni
24.159 Mln
+8.923 Mln
58.57%
1 gen 1973 anni
22.101 Mln
-2.058 Mln
-8.52%
1 gen 1974 anni
5.88 Mln
-16.221 Mln
-73.39%
1 gen 1975 anni
-1.995 Mln
-7.875 Mln
-133.93%
1 gen 1976 anni
-2.135 Mln
-140.0 Mille.
7.02%
1 gen 1977 anni
-2.28 Mln
-145.0 Mille.
6.79%
1 gen 1978 anni
-2.43 Mln
-150.0 Mille.
6.58%
1 gen 1979 anni
-2.595 Mln
-165.0 Mille.
6.79%
1 gen 1980 anni
-2.765 Mln
-170.0 Mille.
6.55%
1 gen 1981 anni
-2.95 Mln
-185.0 Mille.
6.69%
1 gen 1982 anni
-3.15 Mln
-200.0 Mille.
6.78%
1 gen 1983 anni
-3.365 Mln
-215.0 Mille.
6.83%
1 gen 1984 anni
-3.585 Mln
-220.0 Mille.
6.54%
1 gen 1985 anni
-5.59 Mln
-2.005 Mln
55.93%
1 gen 1986 anni
-5.014 Mln
+576.0 Mille.
-10.3%
1 gen 1987 anni
-7.847 Mln
-2.833 Mln
56.5%
1 gen 1988 anni
-10.02 Mln
-2.173 Mln
27.69%
1 gen 1989 anni
-12.042 Mln
-2.022 Mln
20.18%
1 gen 1990 anni
-10.92 Mln
+1.122 Mln
-9.32%
1 gen 1991 anni
-11.862 Mln
-942.0 Mille.
8.63%
1 gen 1992 anni
-12.349 Mln
-487.0 Mille.
4.11%
1 gen 1993 anni
-14.565 Mln
-2.216 Mln
17.94%

Classificazione dei paesi secondo i statistiche attuali per anni