33
/it/
AIzaSyAYiBZKx7MnpbEhh9jyipgxe19OcubqV5w
August 1, 2025
179201
Liberia
LBR
true
2
1
Net financial flows, IBRD (NFL, current US$)
2008,2003,1989,1988,1987,1986,1985,1984,1983,1982,1981,1980,1979,1978,1977,1976,1975,1974,1973,1972,1971
Download
Biblioteca di statistiche globali →Liberia →

Net financial flows, IBRD (NFL, current US$)

Queste statistiche in altri paesi:

AlbaniaAlgeriaAngolaArgentinaArmeniaAzerbaijanBangladeshBelarusBelizeBoliviaBosnia and HerzegovinaBotswanaBrazilBulgariaBurundiCabo VerdeCameroonCaribbean small statesCentral Europe and the BalticsChadChinaColombiaCongo, Dem. Rep.Congo, Rep.Costa RicaCote d'IvoireCroatiaCzech RepublicDominicaDominican RepublicEarly-demographic dividendEast Asia & PacificEast Asia & Pacific (excluding high income)East Asia & Pacific (IDA & IBRD countries)EcuadorEgypt, Arab Rep.El SalvadorEquatorial GuineaEstoniaEthiopiaEurope & Central AsiaEurope & Central Asia (excluding high income)Europe & Central Asia (IDA & IBRD countries)FijiFragile and conflict affected situationsGabonGeorgiaGhanaGreeceGrenadaGuatemalaGuineaGuyanaHondurasHungaryIBRD onlyIDA & IBRD totalIDA blendIDA onlyIDA totalIndiaIndonesiaIran, Islamic Rep.JamaicaJordanKazakhstanKenyaKorea, Rep.KosovoLate-demographic dividendLatin America & Caribbean Latin America & Caribbean (excluding high income)Latin America & the Caribbean (IDA & IBRD countries)LebanonLesothoLiberiaLow & middle incomeLow incomeLower middle incomeMacedonia, FYRMadagascarMalawiMalaysiaMauritaniaMauritiusMexicoMiddle East & North AfricaMiddle East & North Africa (excluding high income)Middle East & North Africa (IDA & IBRD countries)Middle incomeMoldovaMontenegroMoroccoMyanmarNicaraguaNigeriaOmanOther small statesPacific island small statesPakistanPanamaPapua New GuineaParaguayPeruPhilippinesPolandPre-demographic dividendRomaniaRussian FederationSenegalSerbiaSeychellesSierra LeoneSlovak RepublicSloveniaSmall statesSouth AfricaSouth AsiaSouth Asia (IDA & IBRD)Sri LankaSt. Kitts and NevisSt. LuciaSt. Vincent and the GrenadinesSub-Saharan Africa Sub-Saharan Africa (excluding high income)Sub-Saharan Africa (IDA & IBRD countries)SudanSwazilandSyrian Arab RepublicTanzaniaThailandTogoTrinidad and TobagoTunisiaTurkeyTurkmenistanUgandaUkraineUpper middle incomeUzbekistanVenezuela, RBVietnamZambiaZimbabwe

Linea del tempo:

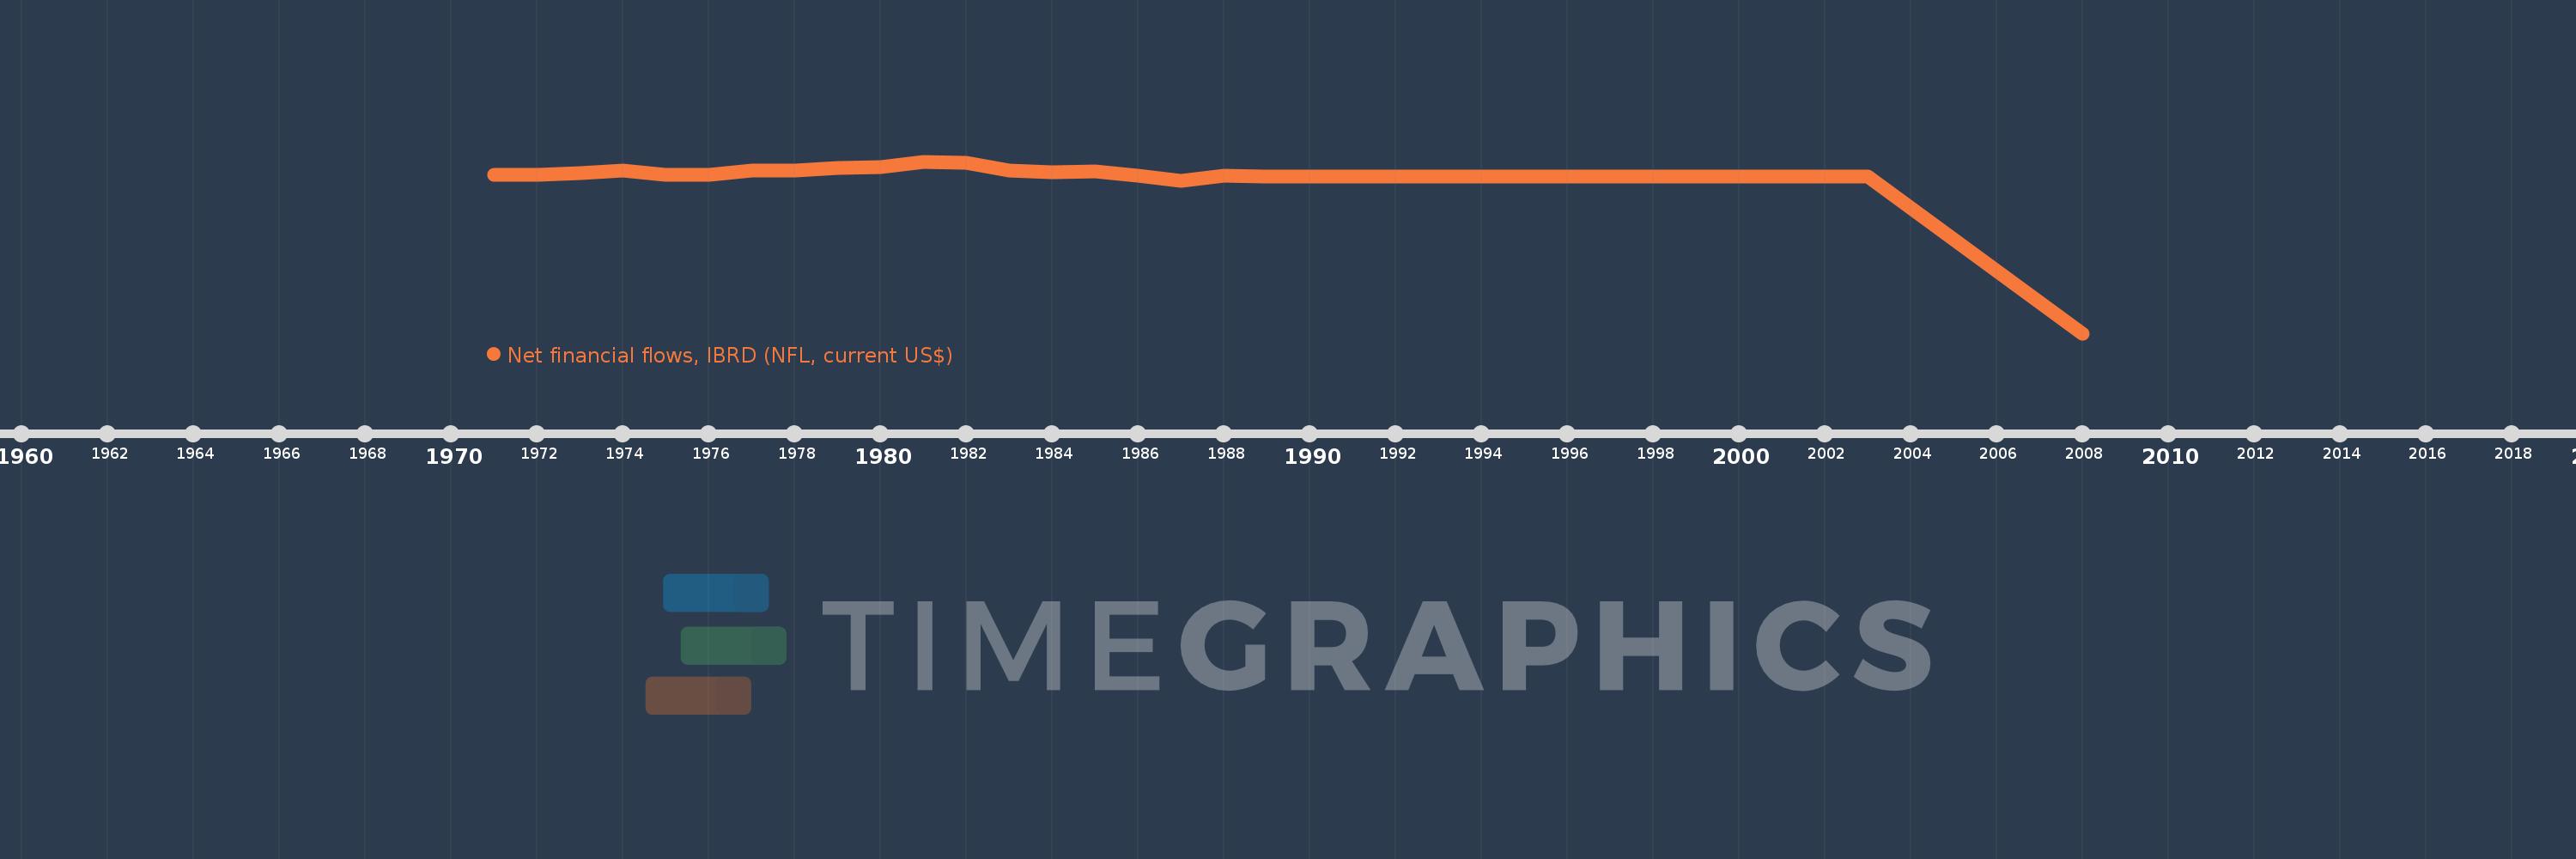
Questa scala temporale mostra un grafico dal 1971 anno al 2008 anno. Liberia. I dati fino ad 1970 anno non disponibili. Il numero di osservazioni attuali secondo i date: 21.

La fonte (nome):

Indicatori dello sviluppo mondiale

La fonte (organizzazione):

World Bank, International Debt Statistics.

Categorie:

External Debt

sono stati aggiornati

23 apr 2017 anni

Indicatori delle variazioni dei valori per anni

In media:
-3.402 Mln
Minima:
-162.52 Mln
1 gen 2008 anni
Massimo:
15.64 Mln
1 gen 1981 anni
Alla data di osservazione
Valore
Variazione assoluta
La variazione rispetto al valore precedente
1 gen 1971 anni
1.749 Mln
+1.749 Mln
0.0%
1 gen 1972 anni
1.806 Mln
+57.0 Mille.
3.26%
1 gen 1973 anni
3.307 Mln
+1.501 Mln
83.11%
1 gen 1974 anni
5.973 Mln
+2.666 Mln
80.62%
1 gen 1975 anni
2.248 Mln
-3.725 Mln
-62.36%
1 gen 1976 anni
1.5 Mln
-748.0 Mille.
-33.27%
1 gen 1977 anni
6.523 Mln
+5.023 Mln
334.87%
1 gen 1978 anni
6.522 Mln
-1000.0
-0.02%
1 gen 1979 anni
8.526 Mln
+2.004 Mln
30.73%
1 gen 1980 anni
9.93 Mln
+1.404 Mln
16.47%
1 gen 1981 anni
15.64 Mln
+5.71 Mln
57.5%
1 gen 1982 anni
14.573 Mln
-1.067 Mln
-6.82%
1 gen 1983 anni
5.933 Mln
-8.64 Mln
-59.29%
1 gen 1984 anni
4.241 Mln
-1.692 Mln
-28.52%
1 gen 1985 anni
5.186 Mln
+945.0 Mille.
22.28%
1 gen 1986 anni
650.0 Mille.
-4.536 Mln
-87.47%
1 gen 1987 anni
-4.653 Mln
-5.303 Mln
-815.85%
1 gen 1988 anni
1.378 Mln
+6.031 Mln
-129.62%
1 gen 1989 anni
51.0 Mille.
-1.327 Mln
-96.3%
1 gen 2003 anni
0.0
-51.0 Mille.
-100.0%
1 gen 2008 anni
-162.52 Mln
-162.52 Mln
%

Classificazione dei paesi secondo i statistiche attuali per anni