29
/it/
it
AIzaSyAYiBZKx7MnpbEhh9jyipgxe19OcubqV5w
April 1, 2024
121237
Dominica
DMA
true
2
1
Net financial flows, IBRD (NFL, current US$)
2016,2015,2014,2013,2012,2011,2010,2009,2008,2007,2006,2005,2004,2003,2002,2001,2000,1999
Download
Biblioteca di statistiche globali →Dominica →

Net financial flows, IBRD (NFL, current US$)

Queste statistiche in altri paesi:
AlbaniaAlgeriaAngolaArgentinaArmeniaAzerbaijanBangladeshBelarusBelizeBoliviaBosnia and HerzegovinaBotswanaBrazilBulgariaBurundiCabo VerdeCameroonCaribbean small statesCentral Europe and the BalticsChadChinaColombiaCongo, Dem. Rep.Congo, Rep.Costa RicaCote d'IvoireCroatiaCzech RepublicDominicaDominican RepublicEarly-demographic dividendEast Asia & PacificEast Asia & Pacific (excluding high income)East Asia & Pacific (IDA & IBRD countries)EcuadorEgypt, Arab Rep.El SalvadorEquatorial GuineaEstoniaEthiopiaEurope & Central AsiaEurope & Central Asia (excluding high income)Europe & Central Asia (IDA & IBRD countries)FijiFragile and conflict affected situationsGabonGeorgiaGhanaGreeceGrenadaGuatemalaGuineaGuyanaHondurasHungaryIBRD onlyIDA & IBRD totalIDA blendIDA onlyIDA totalIndiaIndonesiaIran, Islamic Rep.JamaicaJordanKazakhstanKenyaKorea, Rep.KosovoLate-demographic dividendLatin America & Caribbean Latin America & Caribbean (excluding high income)Latin America & the Caribbean (IDA & IBRD countries)LebanonLesothoLiberiaLow & middle incomeLow incomeLower middle incomeMacedonia, FYRMadagascarMalawiMalaysiaMauritaniaMauritiusMexicoMiddle East & North AfricaMiddle East & North Africa (excluding high income)Middle East & North Africa (IDA & IBRD countries)Middle incomeMoldovaMontenegroMoroccoMyanmarNicaraguaNigeriaOmanOther small statesPacific island small statesPakistanPanamaPapua New GuineaParaguayPeruPhilippinesPolandPre-demographic dividendRomaniaRussian FederationSenegalSerbiaSeychellesSierra LeoneSlovak RepublicSloveniaSmall statesSouth AfricaSouth AsiaSouth Asia (IDA & IBRD)Sri LankaSt. Kitts and NevisSt. LuciaSt. Vincent and the GrenadinesSub-Saharan Africa Sub-Saharan Africa (excluding high income)Sub-Saharan Africa (IDA & IBRD countries)SudanSwazilandSyrian Arab RepublicTanzaniaThailandTogoTrinidad and TobagoTunisiaTurkeyTurkmenistanUgandaUkraineUpper middle incomeUzbekistanVenezuela, RBVietnamZambiaZimbabwe
Linea del tempo:
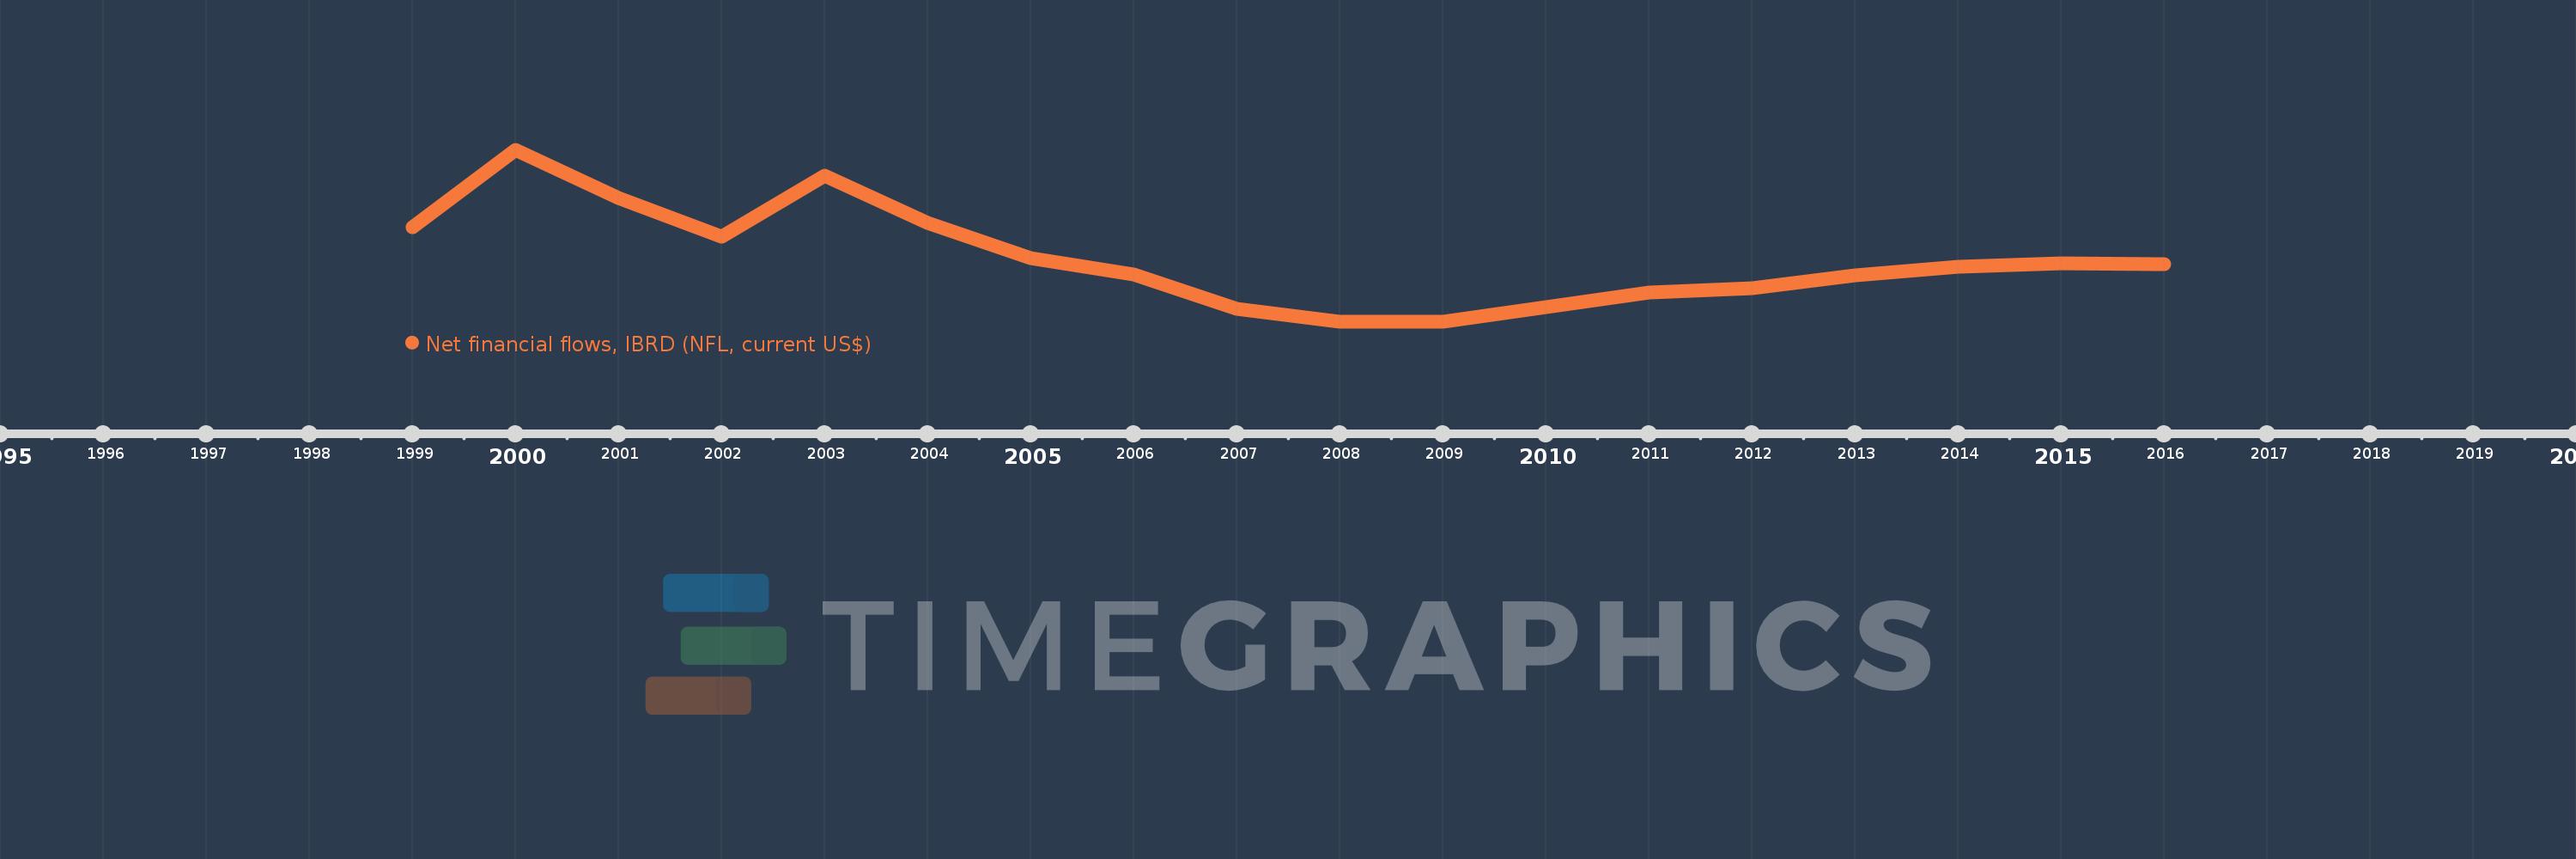
Questa scala temporale mostra un grafico dal 1999 anno al 2016 anno. Dominica. I dati fino ad 1998 anno non disponibili. Il numero di osservazioni attuali secondo i date: 18.
La fonte (nome):
Indicatori dello sviluppo mondiale
La fonte (organizzazione):
World Bank, International Debt Statistics.
Categorie:
External Debt
sono stati aggiornati
23 apr 2017 anni
Indicatori delle variazioni dei valori per anni
In media:
1.611 Mille.
Minima:
-757.0 Mille.
1 gen 2008 anni
Massimo:
1.297 Mln
1 gen 2000 anni
Alla data di osservazione
Valore
Variazione assoluta
La variazione rispetto al valore precedente
1 gen 1999 anni
376.0 Mille.
+376.0 Mille.
0.0%
1 gen 2000 anni
1.297 Mln
+921.0 Mille.
244.95%
1 gen 2001 anni
730.0 Mille.
-567.0 Mille.
-43.72%
1 gen 2002 anni
265.0 Mille.
-465.0 Mille.
-63.7%
1 gen 2003 anni
989.0 Mille.
+724.0 Mille.
273.21%
1 gen 2004 anni
430.0 Mille.
-559.0 Mille.
-56.52%
1 gen 2005 anni
4.0 Mille.
-426.0 Mille.
-99.07%
1 gen 2006 anni
-187.0 Mille.
-191.0 Mille.
-4.78 Mille.%
1 gen 2007 anni
-603.0 Mille.
-416.0 Mille.
222.46%
1 gen 2008 anni
-757.0 Mille.
-154.0 Mille.
25.54%
1 gen 2009 anni
-755.0 Mille.
+2.0 Mille.
-0.26%
1 gen 2010 anni
-577.0 Mille.
+178.0 Mille.
-23.58%
1 gen 2011 anni
-408.0 Mille.
+169.0 Mille.
-29.29%
1 gen 2012 anni
-358.0 Mille.
+50.0 Mille.
-12.25%
1 gen 2013 anni
-200.0 Mille.
+158.0 Mille.
-44.13%
1 gen 2014 anni
-97.0 Mille.
+103.0 Mille.
-51.5%
1 gen 2015 anni
-59.0 Mille.
+38.0 Mille.
-39.18%
1 gen 2016 anni
-61.0 Mille.
-2.0 Mille.
3.39%
Classificazione dei paesi secondo i statistiche attuali per anni

Commenti:

Inviare
PremiumAbout & FeedbackAccordoPrivatezza
logo
© 2022 Selected Technologies LLC – Morgan Hill, California