33
/it/
AIzaSyAYiBZKx7MnpbEhh9jyipgxe19OcubqV5w
August 1, 2025
263759
Timor-Leste
TLS
true
2
1
Net bilateral aid flows from DAC donors, Australia (current US$)
2015,2014,2013,2012,2011,2010,2009,2008,2007,2006,2005,2004,2003,2002,2001,2000,1977,1976
Download
Biblioteca di statistiche globali →Timor-Leste →

Net bilateral aid flows from DAC donors, Australia (current US$)

Queste statistiche in altri paesi:

AfghanistanAlbaniaAlgeriaAngolaAntigua and BarbudaArab WorldArgentinaArmeniaAzerbaijanBahamas, TheBahrainBangladeshBarbadosBelarusBelizeBeninBhutanBoliviaBosnia and HerzegovinaBotswanaBrazilBrunei DarussalamBulgariaBurkina FasoBurundiCabo VerdeCambodiaCameroonCaribbean small statesCayman IslandsCentral African RepublicCentral Europe and the BalticsChadChileChinaColombiaComorosCongo, Dem. Rep.Congo, Rep.Costa RicaCote d'IvoireCroatiaCubaCyprusCzech RepublicDjiboutiDominicaDominican RepublicEast Asia & PacificEast Asia & Pacific (excluding high income)East Asia & Pacific (IDA & IBRD countries)EcuadorEgypt, Arab Rep.El SalvadorEquatorial GuineaEritreaEstoniaEthiopiaEuro areaEurope & Central AsiaEurope & Central Asia (excluding high income)Europe & Central Asia (IDA & IBRD countries)European UnionFijiFragile and conflict affected situationsFrench PolynesiaGabonGambia, TheGeorgiaGhanaGrenadaGuatemalaGuineaGuinea-BissauGuyanaHaitiHeavily indebted poor countries (HIPC)High incomeHondurasHong Kong SAR, ChinaHungaryIBRD onlyIDA & IBRD totalIDA blendIDA onlyIDA totalIndiaIndonesiaIran, Islamic Rep.IraqIsraelJamaicaJordanKazakhstanKenyaKiribatiKorea, Dem. People’s Rep.Korea, Rep.KuwaitKyrgyz RepublicLao PDRLatin America & Caribbean Latin America & Caribbean (excluding high income)Latin America & the Caribbean (IDA & IBRD countries)LatviaLeast developed countries: UN classificationLebanonLesothoLiberiaLibyaLithuaniaLow & middle incomeLow incomeLower middle incomeMacao SAR, ChinaMacedonia, FYRMadagascarMalawiMalaysiaMaldivesMaliMaltaMarshall IslandsMauritaniaMauritiusMexicoMicronesia, Fed. Sts.Middle East & North AfricaMiddle East & North Africa (excluding high income)Middle East & North Africa (IDA & IBRD countries)Middle incomeMoldovaMongoliaMontenegroMoroccoMozambiqueMyanmarNamibiaNauruNepalNew CaledoniaNicaraguaNigerNigeriaNorthern Mariana IslandsOECD membersOmanOther small statesPacific island small statesPakistanPalauPanamaPapua New GuineaParaguayPeruPhilippinesPolandRomaniaRussian FederationRwandaSamoaSao Tome and PrincipeSaudi ArabiaSenegalSerbiaSeychellesSierra LeoneSingaporeSlovak RepublicSloveniaSmall statesSolomon IslandsSomaliaSouth AfricaSouth AsiaSouth Asia (IDA & IBRD)South SudanSri LankaSt. Kitts and NevisSt. LuciaSt. Vincent and the GrenadinesSub-Saharan Africa Sub-Saharan Africa (excluding high income)Sub-Saharan Africa (IDA & IBRD countries)SudanSurinameSwazilandSyrian Arab RepublicTajikistanTanzaniaThailandTimor-LesteTogoTongaTrinidad and TobagoTunisiaTurkeyTurkmenistanTurks and Caicos IslandsTuvaluUgandaUkraineUpper middle incomeUruguayUzbekistanVanuatuVenezuela, RBVietnamWest Bank and GazaWorldYemen, Rep.ZambiaZimbabwe

Linea del tempo:

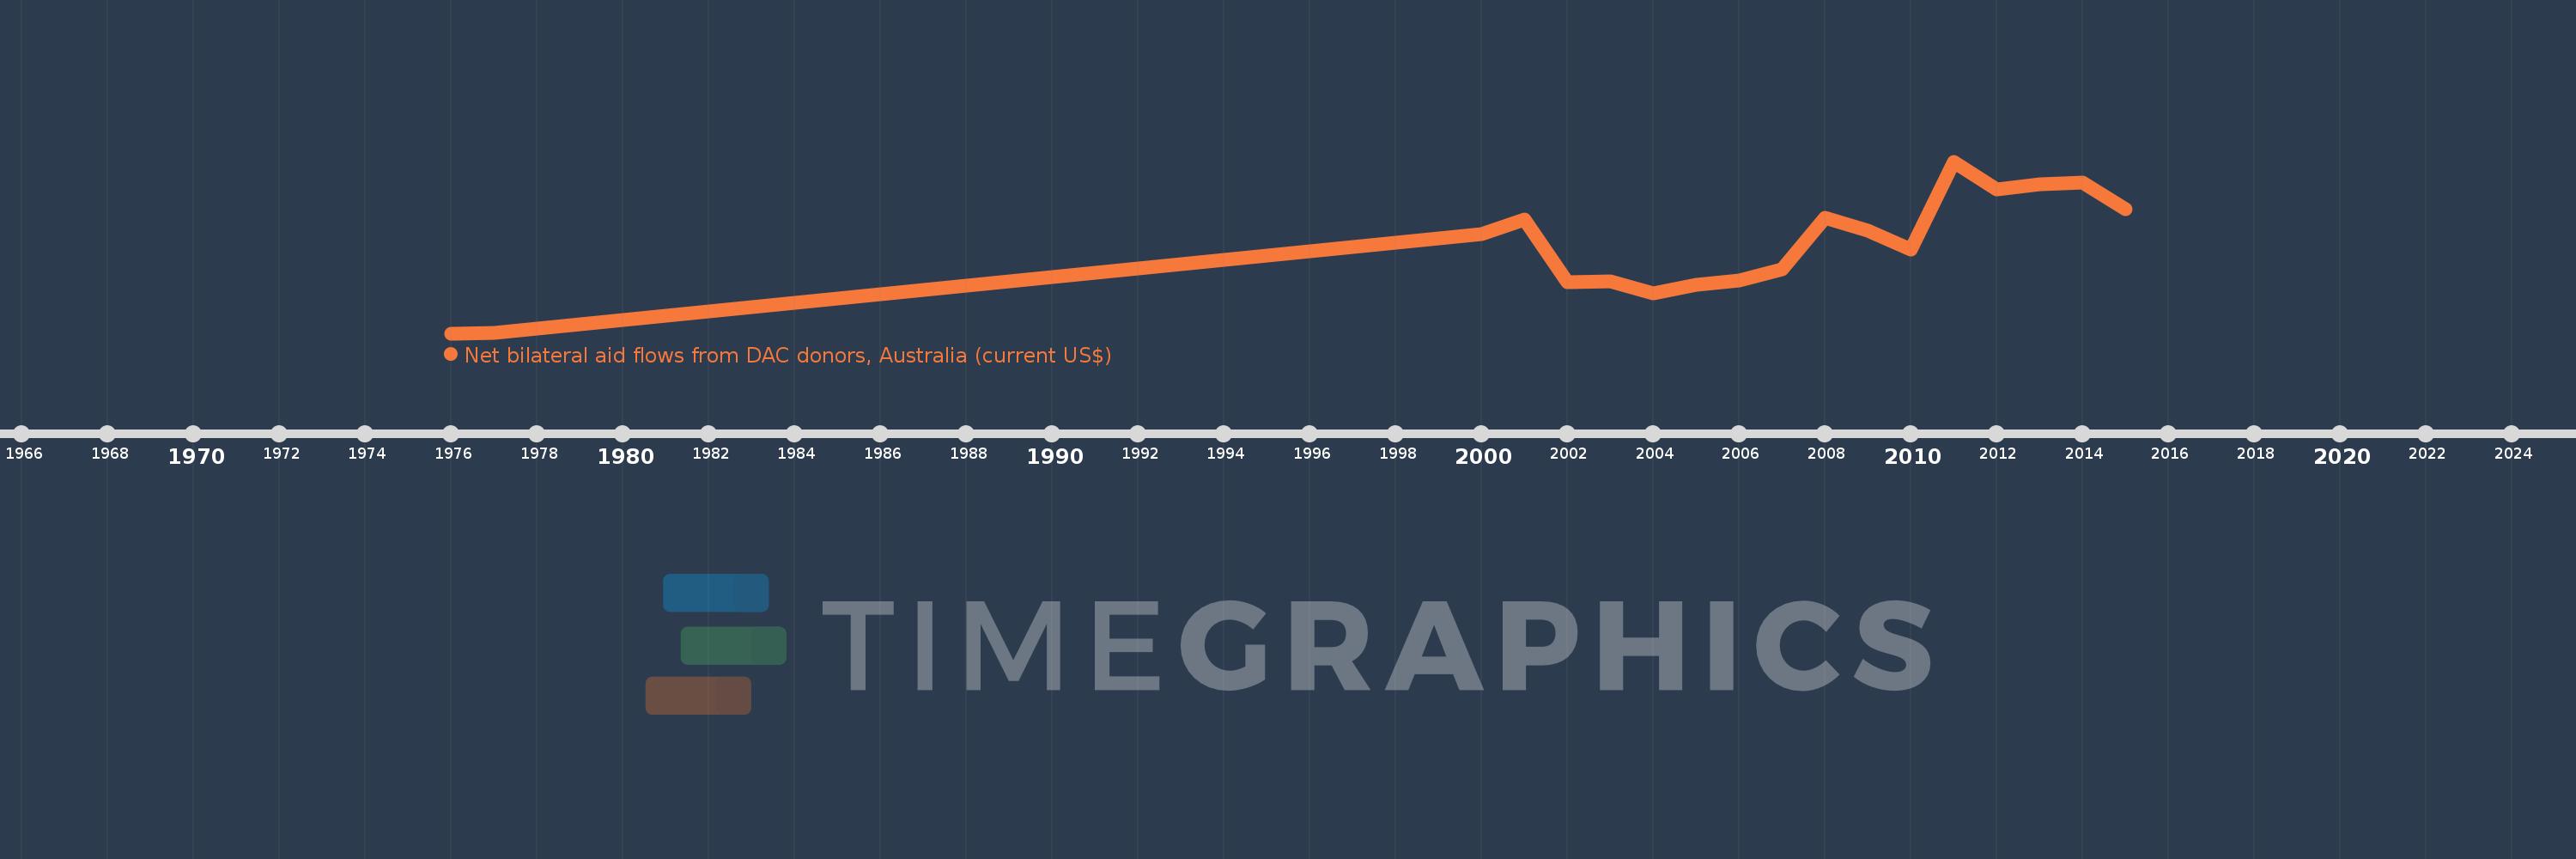
Questa scala temporale mostra un grafico dal 1976 anno al 2015 anno. Timor-Leste. I dati fino ad 1975 anno non disponibili. Il numero di osservazioni attuali secondo i date: 18.

La fonte (nome):

Indicatori dello sviluppo mondiale

La fonte (organizzazione):

Development Assistance Committee of the Organisation for Economic Co-operation and Development, Geographical Distribution of Financial Flows to Developing Countries, Development Co-operation Report, and International Development Statistics database. Data are available online at: www.oecd.org/dac/stats/idsonline.

Categorie:

Aid Effectiveness

sono stati aggiornati

23 apr 2017 anni

Indicatori delle variazioni dei valori per anni

In media:
62.771 Mln
Minima:
200.0 Mille.
1 gen 1976 anni
Massimo:
124.01 Mln
1 gen 2011 anni
Alla data di osservazione
Valore
Variazione assoluta
La variazione rispetto al valore precedente
1 gen 1976 anni
200.0 Mille.
+200.0 Mille.
0.0%
1 gen 1977 anni
430.0 Mille.
+230.0 Mille.
115.0%
1 gen 2000 anni
71.7 Mln
+71.27 Mln
16.57 Mille.%
1 gen 2001 anni
82.44 Mln
+10.74 Mln
14.98%
1 gen 2002 anni
37.25 Mln
-45.19 Mln
-54.82%
1 gen 2003 anni
37.52 Mln
+270.0 Mille.
0.72%
1 gen 2004 anni
28.87 Mln
-8.65 Mln
-23.05%
1 gen 2005 anni
35.25 Mln
+6.38 Mln
22.1%
1 gen 2006 anni
38.02 Mln
+2.77 Mln
7.86%
1 gen 2007 anni
46.08 Mln
+8.06 Mln
21.2%
1 gen 2008 anni
83.35 Mln
+37.27 Mln
80.88%
1 gen 2009 anni
74.48 Mln
-8.87 Mln
-10.64%
1 gen 2010 anni
60.71 Mln
-13.77 Mln
-18.49%
1 gen 2011 anni
124.01 Mln
+63.3 Mln
104.27%
1 gen 2012 anni
103.87 Mln
-20.14 Mln
-16.24%
1 gen 2013 anni
107.48 Mln
+3.61 Mln
3.48%
1 gen 2014 anni
108.57 Mln
+1.09 Mln
1.01%
1 gen 2015 anni
89.64 Mln
-18.93 Mln
-17.44%

Classificazione dei paesi secondo i statistiche attuali per anni