33
/it/
AIzaSyB4mHJ5NPEv-XzF7P6NDYXjlkCWaeKw5bc
November 30, 2025
258626
Syrian Arab Republic
SYR
true
2
1
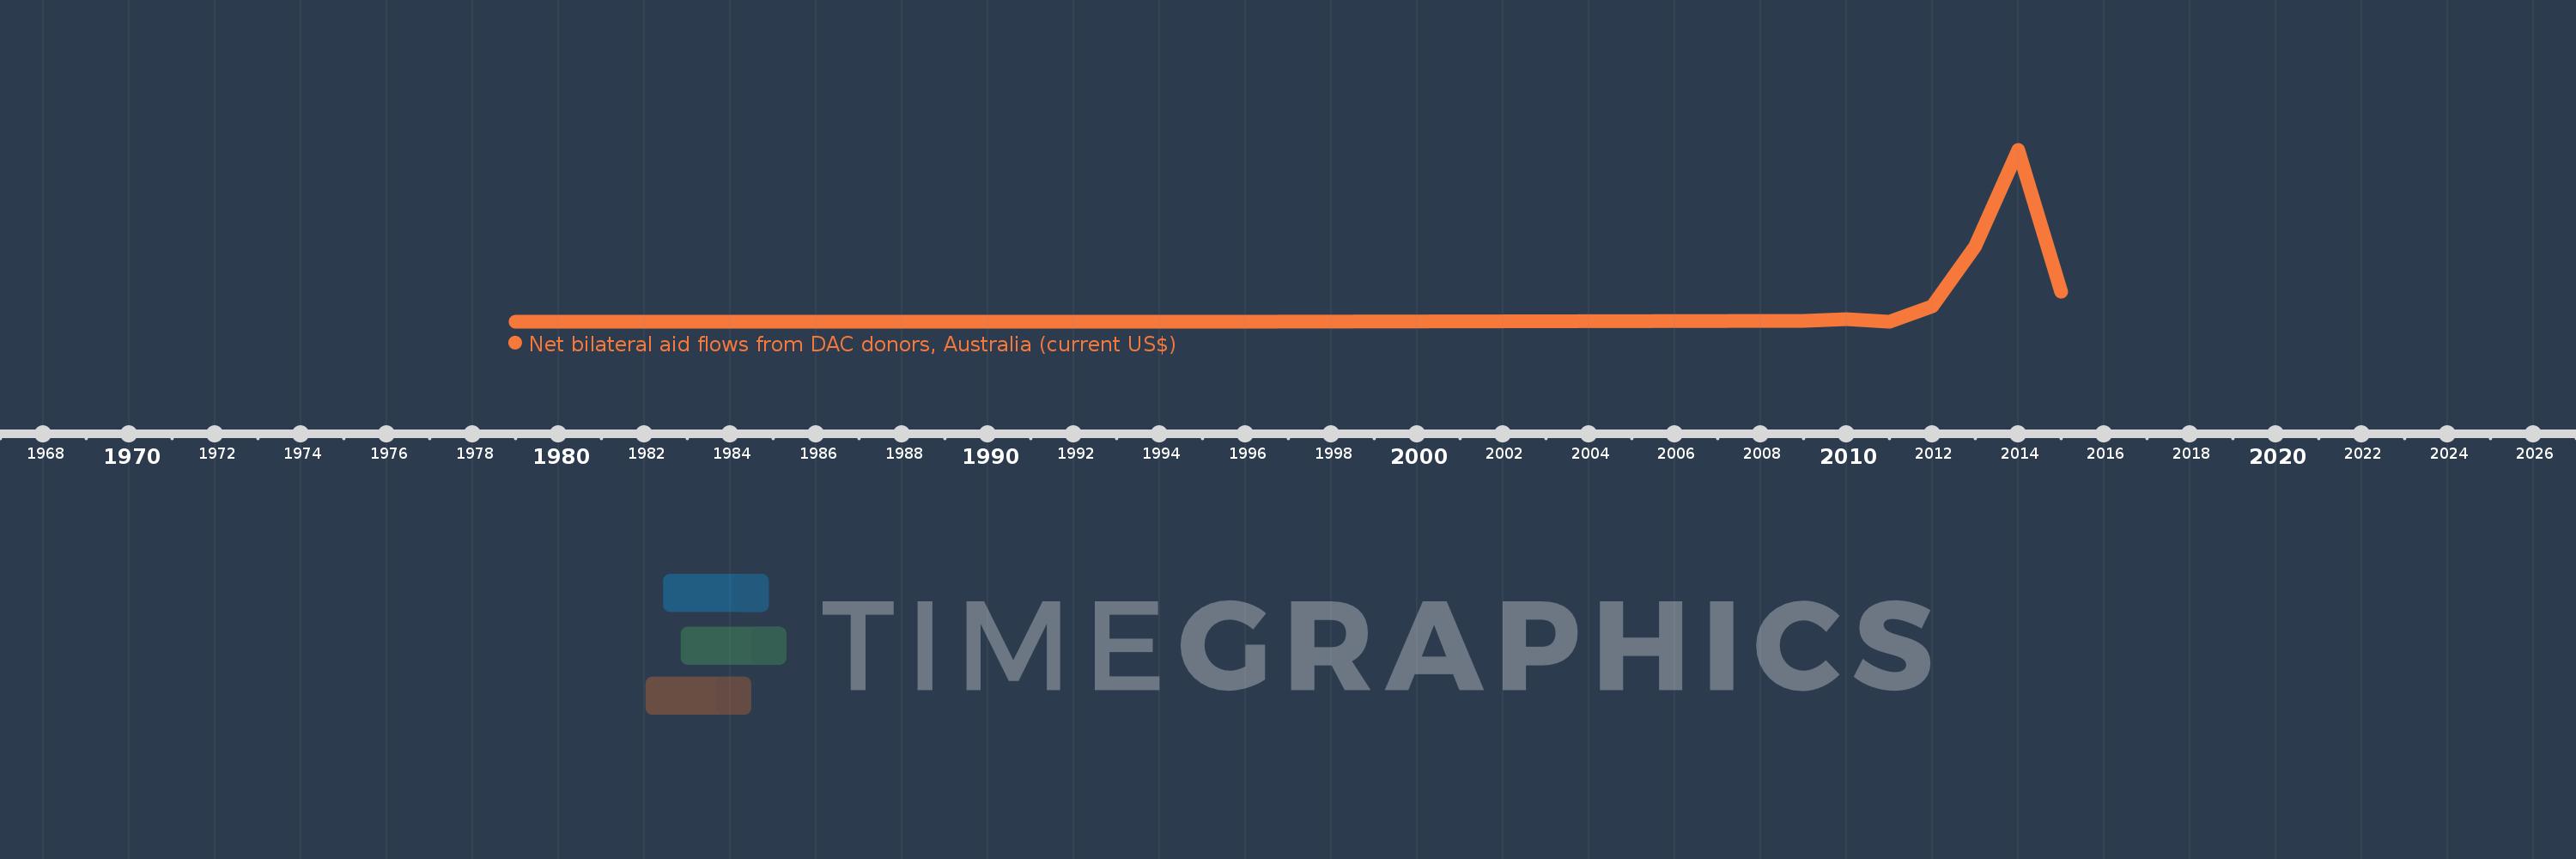
Net bilateral aid flows from DAC donors, Australia (current US$)
2015,2014,2013,2012,2011,2010,2009,1995,1993,1992,1991,1990,1989,1986,1985,1984,1983,1982,1981,1980,1979