29
/it/
it
AIzaSyAYiBZKx7MnpbEhh9jyipgxe19OcubqV5w
April 1, 2024
25940
Central Europe and the Baltics
CEB
false
2
1
Net bilateral aid flows from DAC donors, Australia (current US$)
2011,2010,2009,2008,2005,2004,2003,2002,1998,1997,1996,1995,1994,1993,1992
Download
Biblioteca di statistiche globali →Central Europe and the Baltics →

Net bilateral aid flows from DAC donors, Australia (current US$)

Queste statistiche in altri paesi:
AfghanistanAlbaniaAlgeriaAngolaAntigua and BarbudaArab WorldArgentinaArmeniaAzerbaijanBahamas, TheBahrainBangladeshBarbadosBelarusBelizeBeninBhutanBoliviaBosnia and HerzegovinaBotswanaBrazilBrunei DarussalamBulgariaBurkina FasoBurundiCabo VerdeCambodiaCameroonCaribbean small statesCayman IslandsCentral African RepublicCentral Europe and the BalticsChadChileChinaColombiaComorosCongo, Dem. Rep.Congo, Rep.Costa RicaCote d'IvoireCroatiaCubaCyprusCzech RepublicDjiboutiDominicaDominican RepublicEast Asia & PacificEast Asia & Pacific (excluding high income)East Asia & Pacific (IDA & IBRD countries)EcuadorEgypt, Arab Rep.El SalvadorEquatorial GuineaEritreaEstoniaEthiopiaEuro areaEurope & Central AsiaEurope & Central Asia (excluding high income)Europe & Central Asia (IDA & IBRD countries)European UnionFijiFragile and conflict affected situationsFrench PolynesiaGabonGambia, TheGeorgiaGhanaGrenadaGuatemalaGuineaGuinea-BissauGuyanaHaitiHeavily indebted poor countries (HIPC)High incomeHondurasHong Kong SAR, ChinaHungaryIBRD onlyIDA & IBRD totalIDA blendIDA onlyIDA totalIndiaIndonesiaIran, Islamic Rep.IraqIsraelJamaicaJordanKazakhstanKenyaKiribatiKorea, Dem. People’s Rep.Korea, Rep.KuwaitKyrgyz RepublicLao PDRLatin America & Caribbean Latin America & Caribbean (excluding high income)Latin America & the Caribbean (IDA & IBRD countries)LatviaLeast developed countries: UN classificationLebanonLesothoLiberiaLibyaLithuaniaLow & middle incomeLow incomeLower middle incomeMacao SAR, ChinaMacedonia, FYRMadagascarMalawiMalaysiaMaldivesMaliMaltaMarshall IslandsMauritaniaMauritiusMexicoMicronesia, Fed. Sts.Middle East & North AfricaMiddle East & North Africa (excluding high income)Middle East & North Africa (IDA & IBRD countries)Middle incomeMoldovaMongoliaMontenegroMoroccoMozambiqueMyanmarNamibiaNauruNepalNew CaledoniaNicaraguaNigerNigeriaNorthern Mariana IslandsOECD membersOmanOther small statesPacific island small statesPakistanPalauPanamaPapua New GuineaParaguayPeruPhilippinesPolandRomaniaRussian FederationRwandaSamoaSao Tome and PrincipeSaudi ArabiaSenegalSerbiaSeychellesSierra LeoneSingaporeSlovak RepublicSloveniaSmall statesSolomon IslandsSomaliaSouth AfricaSouth AsiaSouth Asia (IDA & IBRD)South SudanSri LankaSt. Kitts and NevisSt. LuciaSt. Vincent and the GrenadinesSub-Saharan Africa Sub-Saharan Africa (excluding high income)Sub-Saharan Africa (IDA & IBRD countries)SudanSurinameSwazilandSyrian Arab RepublicTajikistanTanzaniaThailandTimor-LesteTogoTongaTrinidad and TobagoTunisiaTurkeyTurkmenistanTurks and Caicos IslandsTuvaluUgandaUkraineUpper middle incomeUruguayUzbekistanVanuatuVenezuela, RBVietnamWest Bank and GazaWorldYemen, Rep.ZambiaZimbabwe
Linea del tempo:
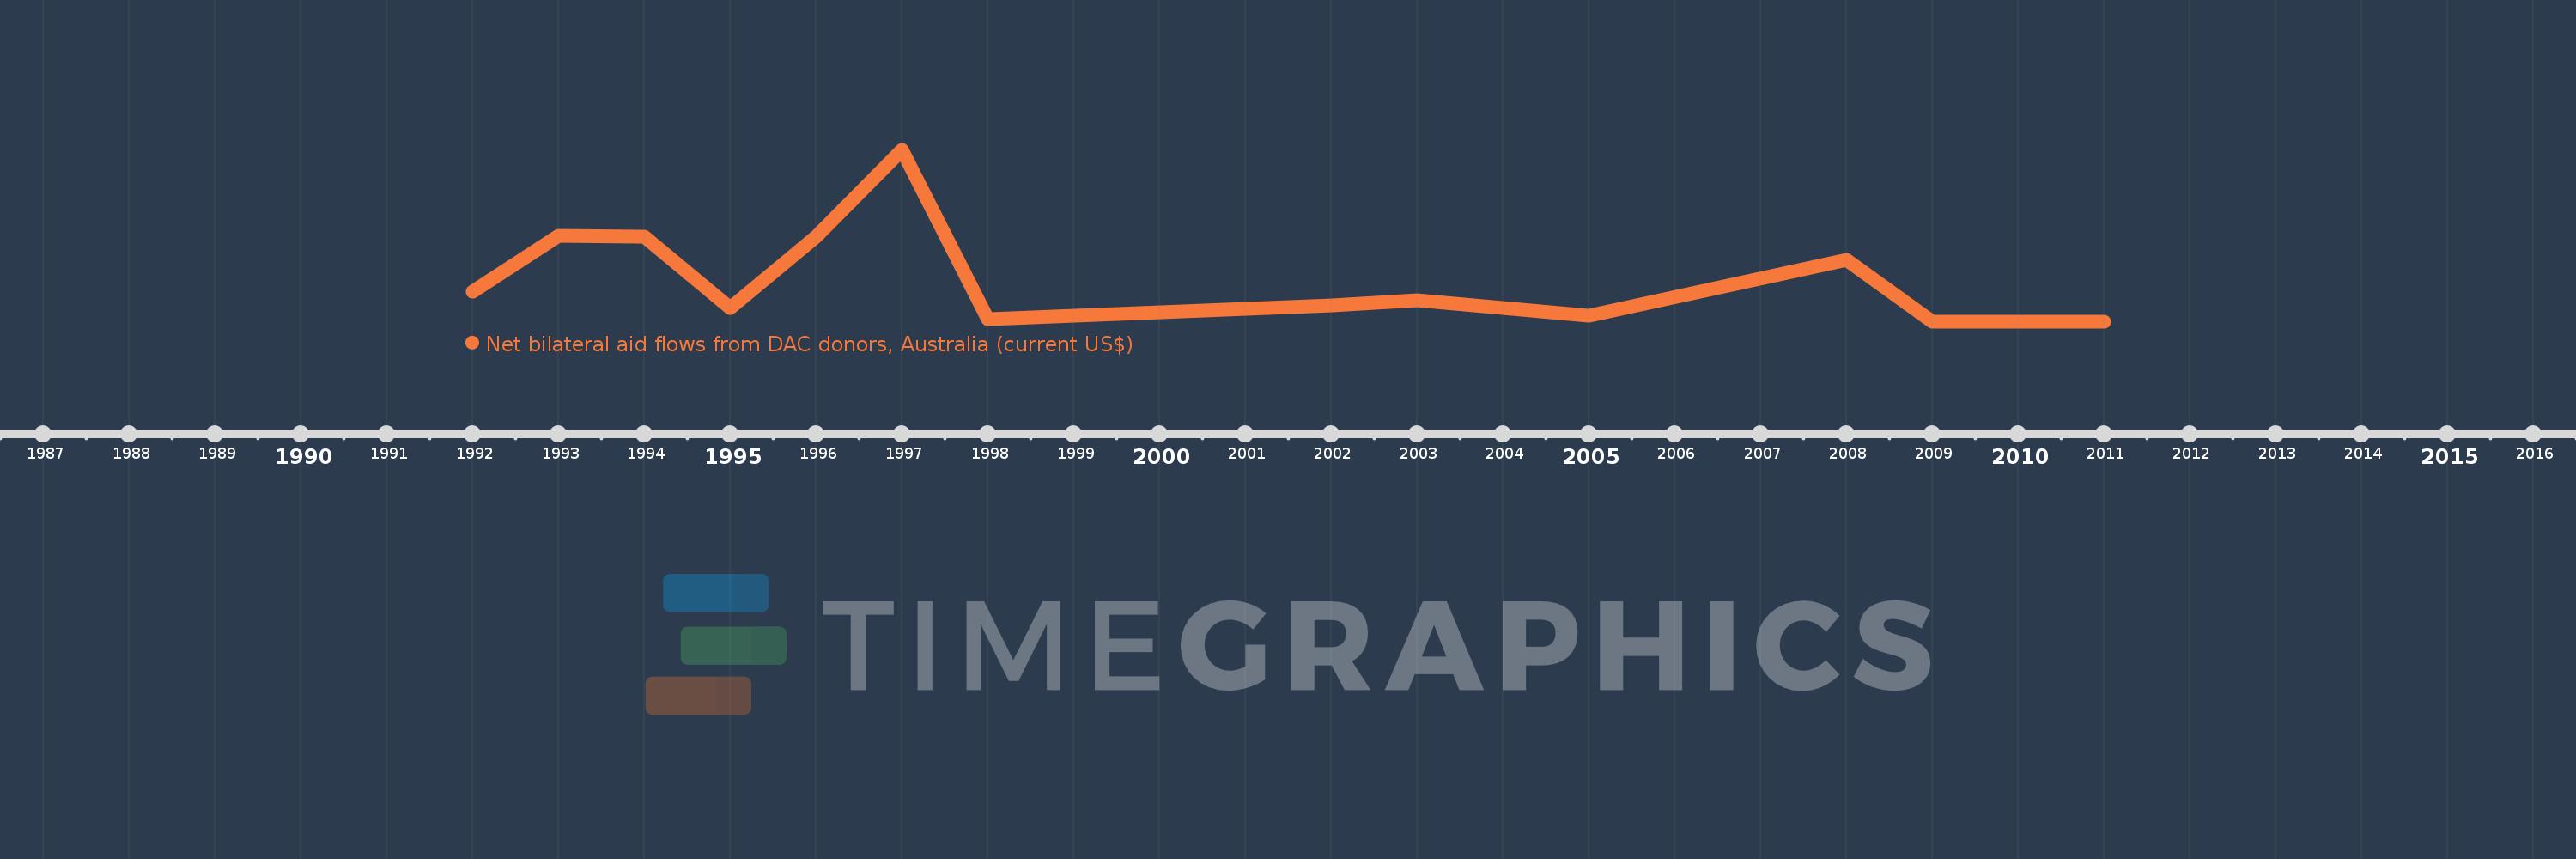
Questa scala temporale mostra un grafico dal 1992 anno al 2011 anno. Central Europe and the Baltics. I dati fino ad 1991 anno non disponibili. Il numero di osservazioni attuali secondo i date: 15.
La fonte (nome):
Indicatori dello sviluppo mondiale
La fonte (organizzazione):
Development Assistance Committee of the Organisation for Economic Co-operation and Development, Geographical Distribution of Financial Flows to Developing Countries, Development Co-operation Report, and International Development Statistics database. Data are available online at: www.oecd.org/dac/stats/idsonline.
Categorie:
Aid Effectiveness
sono stati aggiornati
23 apr 2017 anni
Indicatori delle variazioni dei valori per anni
In media:
536.0 Mille.
Minima:
10.0 Mille.
1 gen 2009 anni
Massimo:
2.28 Mln
1 gen 1997 anni
Alla data di osservazione
Valore
Variazione assoluta
La variazione rispetto al valore precedente
1 gen 1992 anni
410.0 Mille.
+410.0 Mille.
0.0%
1 gen 1993 anni
1.15 Mln
+740.0 Mille.
180.49%
1 gen 1994 anni
1.14 Mln
-10.0 Mille.
-0.87%
1 gen 1995 anni
200.0 Mille.
-940.0 Mille.
-82.46%
1 gen 1996 anni
1.14 Mln
+940.0 Mille.
470.0%
1 gen 1997 anni
2.28 Mln
+1.14 Mln
100.0%
1 gen 1998 anni
50.0 Mille.
-2.23 Mln
-97.81%
1 gen 2002 anni
230.0 Mille.
+180.0 Mille.
360.0%
1 gen 2003 anni
300.0 Mille.
+70.0 Mille.
30.43%
1 gen 2004 anni
190.0 Mille.
-110.0 Mille.
-36.67%
1 gen 2005 anni
90.0 Mille.
-100.0 Mille.
-52.63%
1 gen 2008 anni
830.0 Mille.
+740.0 Mille.
822.22%
1 gen 2009 anni
10.0 Mille.
-820.0 Mille.
-98.8%
1 gen 2010 anni
10.0 Mille.
0.0
0.0%
1 gen 2011 anni
10.0 Mille.
0.0
0.0%
Classificazione dei paesi secondo i statistiche attuali per anni

Commenti:

Inviare
PremiumAbout & FeedbackAccordoPrivatezza
logo
© 2022 Selected Technologies LLC – Morgan Hill, California