33
/it/
AIzaSyAYiBZKx7MnpbEhh9jyipgxe19OcubqV5w
August 1, 2025
158699
Iraq
IRQ
true
2
1
Net bilateral aid flows from DAC donors, Australia (current US$)
2015,2014,2013,2012,2011,2010,2009,2008,2007,2006,2005,2004,1998,1996,1994,1993,1992,1991,1990,1989,1979
Download
Biblioteca di statistiche globali →Iraq →

Net bilateral aid flows from DAC donors, Australia (current US$)

Queste statistiche in altri paesi:

AfghanistanAlbaniaAlgeriaAngolaAntigua and BarbudaArab WorldArgentinaArmeniaAzerbaijanBahamas, TheBahrainBangladeshBarbadosBelarusBelizeBeninBhutanBoliviaBosnia and HerzegovinaBotswanaBrazilBrunei DarussalamBulgariaBurkina FasoBurundiCabo VerdeCambodiaCameroonCaribbean small statesCayman IslandsCentral African RepublicCentral Europe and the BalticsChadChileChinaColombiaComorosCongo, Dem. Rep.Congo, Rep.Costa RicaCote d'IvoireCroatiaCubaCyprusCzech RepublicDjiboutiDominicaDominican RepublicEast Asia & PacificEast Asia & Pacific (excluding high income)East Asia & Pacific (IDA & IBRD countries)EcuadorEgypt, Arab Rep.El SalvadorEquatorial GuineaEritreaEstoniaEthiopiaEuro areaEurope & Central AsiaEurope & Central Asia (excluding high income)Europe & Central Asia (IDA & IBRD countries)European UnionFijiFragile and conflict affected situationsFrench PolynesiaGabonGambia, TheGeorgiaGhanaGrenadaGuatemalaGuineaGuinea-BissauGuyanaHaitiHeavily indebted poor countries (HIPC)High incomeHondurasHong Kong SAR, ChinaHungaryIBRD onlyIDA & IBRD totalIDA blendIDA onlyIDA totalIndiaIndonesiaIran, Islamic Rep.IraqIsraelJamaicaJordanKazakhstanKenyaKiribatiKorea, Dem. People’s Rep.Korea, Rep.KuwaitKyrgyz RepublicLao PDRLatin America & Caribbean Latin America & Caribbean (excluding high income)Latin America & the Caribbean (IDA & IBRD countries)LatviaLeast developed countries: UN classificationLebanonLesothoLiberiaLibyaLithuaniaLow & middle incomeLow incomeLower middle incomeMacao SAR, ChinaMacedonia, FYRMadagascarMalawiMalaysiaMaldivesMaliMaltaMarshall IslandsMauritaniaMauritiusMexicoMicronesia, Fed. Sts.Middle East & North AfricaMiddle East & North Africa (excluding high income)Middle East & North Africa (IDA & IBRD countries)Middle incomeMoldovaMongoliaMontenegroMoroccoMozambiqueMyanmarNamibiaNauruNepalNew CaledoniaNicaraguaNigerNigeriaNorthern Mariana IslandsOECD membersOmanOther small statesPacific island small statesPakistanPalauPanamaPapua New GuineaParaguayPeruPhilippinesPolandRomaniaRussian FederationRwandaSamoaSao Tome and PrincipeSaudi ArabiaSenegalSerbiaSeychellesSierra LeoneSingaporeSlovak RepublicSloveniaSmall statesSolomon IslandsSomaliaSouth AfricaSouth AsiaSouth Asia (IDA & IBRD)South SudanSri LankaSt. Kitts and NevisSt. LuciaSt. Vincent and the GrenadinesSub-Saharan Africa Sub-Saharan Africa (excluding high income)Sub-Saharan Africa (IDA & IBRD countries)SudanSurinameSwazilandSyrian Arab RepublicTajikistanTanzaniaThailandTimor-LesteTogoTongaTrinidad and TobagoTunisiaTurkeyTurkmenistanTurks and Caicos IslandsTuvaluUgandaUkraineUpper middle incomeUruguayUzbekistanVanuatuVenezuela, RBVietnamWest Bank and GazaWorldYemen, Rep.ZambiaZimbabwe

Linea del tempo:

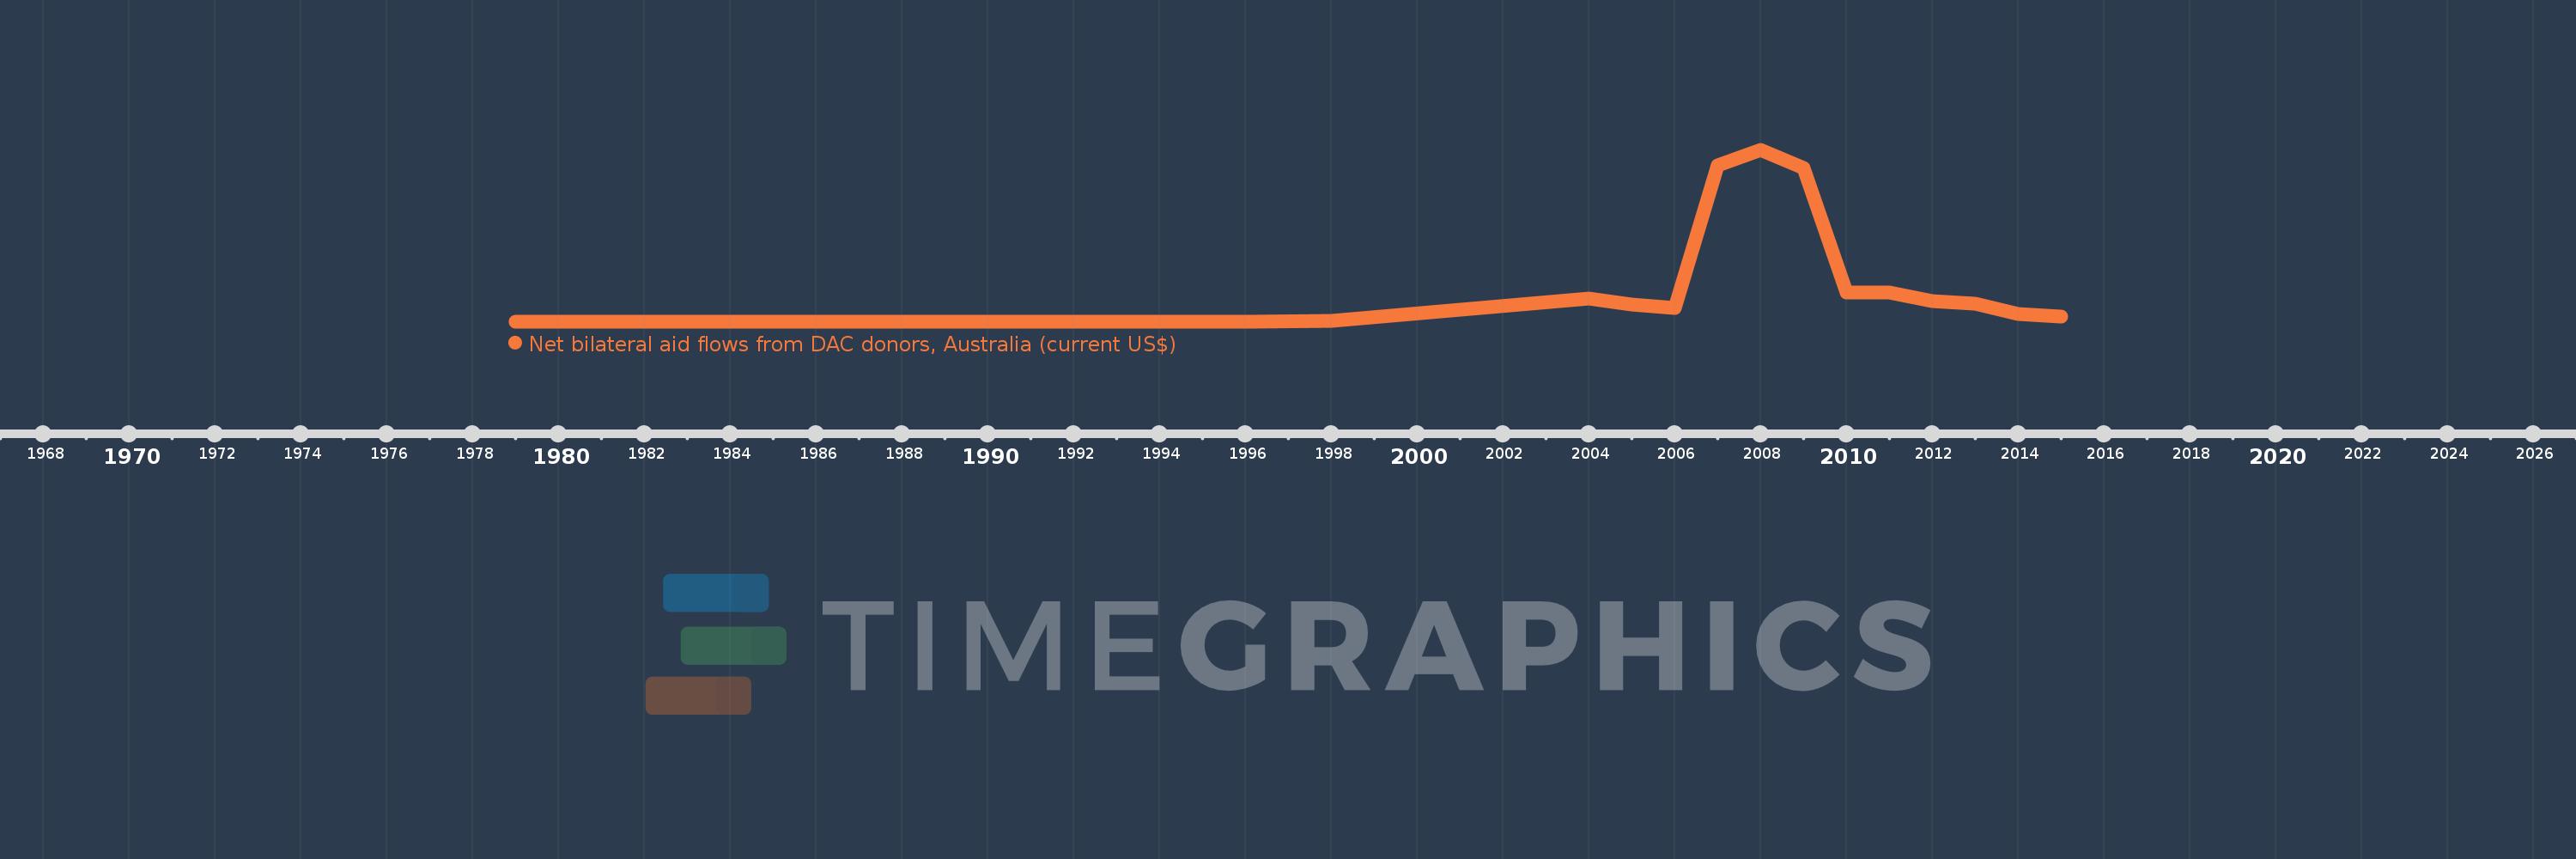
Questa scala temporale mostra un grafico dal 1979 anno al 2015 anno. Iraq. I dati fino ad 1978 anno non disponibili. Il numero di osservazioni attuali secondo i date: 21.

La fonte (nome):

Indicatori dello sviluppo mondiale

La fonte (organizzazione):

Development Assistance Committee of the Organisation for Economic Co-operation and Development, Geographical Distribution of Financial Flows to Developing Countries, Development Co-operation Report, and International Development Statistics database. Data are available online at: www.oecd.org/dac/stats/idsonline.

Categorie:

Aid Effectiveness

sono stati aggiornati

23 apr 2017 anni

Indicatori delle variazioni dei valori per anni

In media:
54.326 Mln
Minima:
10.0 Mille.
1 gen 1979 anni
Massimo:
300.62 Mln
1 gen 2008 anni
Alla data di osservazione
Valore
Variazione assoluta
La variazione rispetto al valore precedente
1 gen 1979 anni
10.0 Mille.
+10.0 Mille.
0.0%
1 gen 1989 anni
130.0 Mille.
+120.0 Mille.
1.2 Mille.%
1 gen 1990 anni
80.0 Mille.
-50.0 Mille.
-38.46%
1 gen 1991 anni
60.0 Mille.
-20.0 Mille.
-25.0%
1 gen 1992 anni
40.0 Mille.
-20.0 Mille.
-33.33%
1 gen 1993 anni
240.0 Mille.
+200.0 Mille.
500.0%
1 gen 1994 anni
480.0 Mille.
+240.0 Mille.
100.0%
1 gen 1996 anni
220.0 Mille.
-260.0 Mille.
-54.17%
1 gen 1998 anni
1.43 Mln
+1.21 Mln
550.0%
1 gen 2004 anni
41.12 Mln
+39.69 Mln
2.78 Mille.%
1 gen 2005 anni
30.73 Mln
-10.39 Mln
-25.27%
1 gen 2006 anni
24.56 Mln
-6.17 Mln
-20.08%
1 gen 2007 anni
274.61 Mln
+250.05 Mln
1.02 Mille.%
1 gen 2008 anni
300.62 Mln
+26.01 Mln
9.47%
1 gen 2009 anni
269.93 Mln
-30.69 Mln
-10.21%
1 gen 2010 anni
52.18 Mln
-217.75 Mln
-80.67%
1 gen 2011 anni
52.22 Mln
+40.0 Mille.
0.08%
1 gen 2012 anni
37.18 Mln
-15.04 Mln
-28.8%
1 gen 2013 anni
31.67 Mln
-5.51 Mln
-14.82%
1 gen 2014 anni
13.58 Mln
-18.09 Mln
-57.12%
1 gen 2015 anni
9.75 Mln
-3.83 Mln
-28.2%

Classificazione dei paesi secondo i statistiche attuali per anni