33
/it/
AIzaSyAYiBZKx7MnpbEhh9jyipgxe19OcubqV5w
May 1, 2025
177955
Lesotho
LSO
true
2
1
Net bilateral aid flows from DAC donors, Italy (current US$)
2009,2003,2000,1998,1997,1995,1994,1993,1992,1991,1990,1989,1988,1987,1986,1985,1984,1983,1974
Download
Biblioteca di statistiche globali →Lesotho →

Net bilateral aid flows from DAC donors, Italy (current US$)

Queste statistiche in altri paesi:

AfghanistanAlbaniaAlgeriaAngolaAntigua and BarbudaArab WorldArgentinaArmeniaAzerbaijanBahamas, TheBangladeshBarbadosBelarusBelizeBeninBhutanBoliviaBosnia and HerzegovinaBotswanaBrazilBulgariaBurkina FasoBurundiCabo VerdeCambodiaCameroonCaribbean small statesCentral African RepublicCentral Europe and the BalticsChadChileChinaColombiaComorosCongo, Dem. Rep.Congo, Rep.Costa RicaCote d'IvoireCroatiaCubaCyprusCzech RepublicDjiboutiDominicaDominican RepublicEast Asia & PacificEast Asia & Pacific (excluding high income)East Asia & Pacific (IDA & IBRD countries)EcuadorEgypt, Arab Rep.El SalvadorEquatorial GuineaEritreaEstoniaEthiopiaEuro areaEurope & Central AsiaEurope & Central Asia (excluding high income)Europe & Central Asia (IDA & IBRD countries)European UnionFijiFragile and conflict affected situationsGabonGambia, TheGeorgiaGhanaGuatemalaGuineaGuinea-BissauGuyanaHaitiHeavily indebted poor countries (HIPC)High incomeHondurasHong Kong SAR, ChinaHungaryIBRD onlyIDA & IBRD totalIDA blendIDA onlyIDA totalIndiaIndonesiaIran, Islamic Rep.IraqIsraelJamaicaJordanKazakhstanKenyaKiribatiKorea, Dem. People’s Rep.Korea, Rep.KosovoKuwaitKyrgyz RepublicLao PDRLatin America & Caribbean Latin America & Caribbean (excluding high income)Latin America & the Caribbean (IDA & IBRD countries)LatviaLeast developed countries: UN classificationLebanonLesothoLiberiaLibyaLithuaniaLow & middle incomeLow incomeLower middle incomeMacedonia, FYRMadagascarMalawiMalaysiaMaldivesMaliMaltaMarshall IslandsMauritaniaMauritiusMexicoMiddle East & North AfricaMiddle East & North Africa (excluding high income)Middle East & North Africa (IDA & IBRD countries)Middle incomeMoldovaMongoliaMontenegroMoroccoMozambiqueMyanmarNamibiaNauruNepalNicaraguaNigerNigeriaOECD membersOmanOther small statesPacific island small statesPakistanPalauPanamaPapua New GuineaParaguayPeruPhilippinesPolandRomaniaRussian FederationRwandaSamoaSao Tome and PrincipeSaudi ArabiaSenegalSerbiaSeychellesSierra LeoneSingaporeSlovak RepublicSloveniaSmall statesSolomon IslandsSomaliaSouth AfricaSouth AsiaSouth Asia (IDA & IBRD)South SudanSri LankaSt. Kitts and NevisSt. LuciaSt. Vincent and the GrenadinesSub-Saharan Africa Sub-Saharan Africa (excluding high income)Sub-Saharan Africa (IDA & IBRD countries)SudanSurinameSwazilandSyrian Arab RepublicTajikistanTanzaniaThailandTimor-LesteTogoTongaTrinidad and TobagoTunisiaTurkeyTurkmenistanTuvaluUgandaUkraineUnited Arab EmiratesUpper middle incomeUruguayUzbekistanVanuatuVenezuela, RBVietnamWest Bank and GazaWorldYemen, Rep.ZambiaZimbabwe

Linea del tempo:

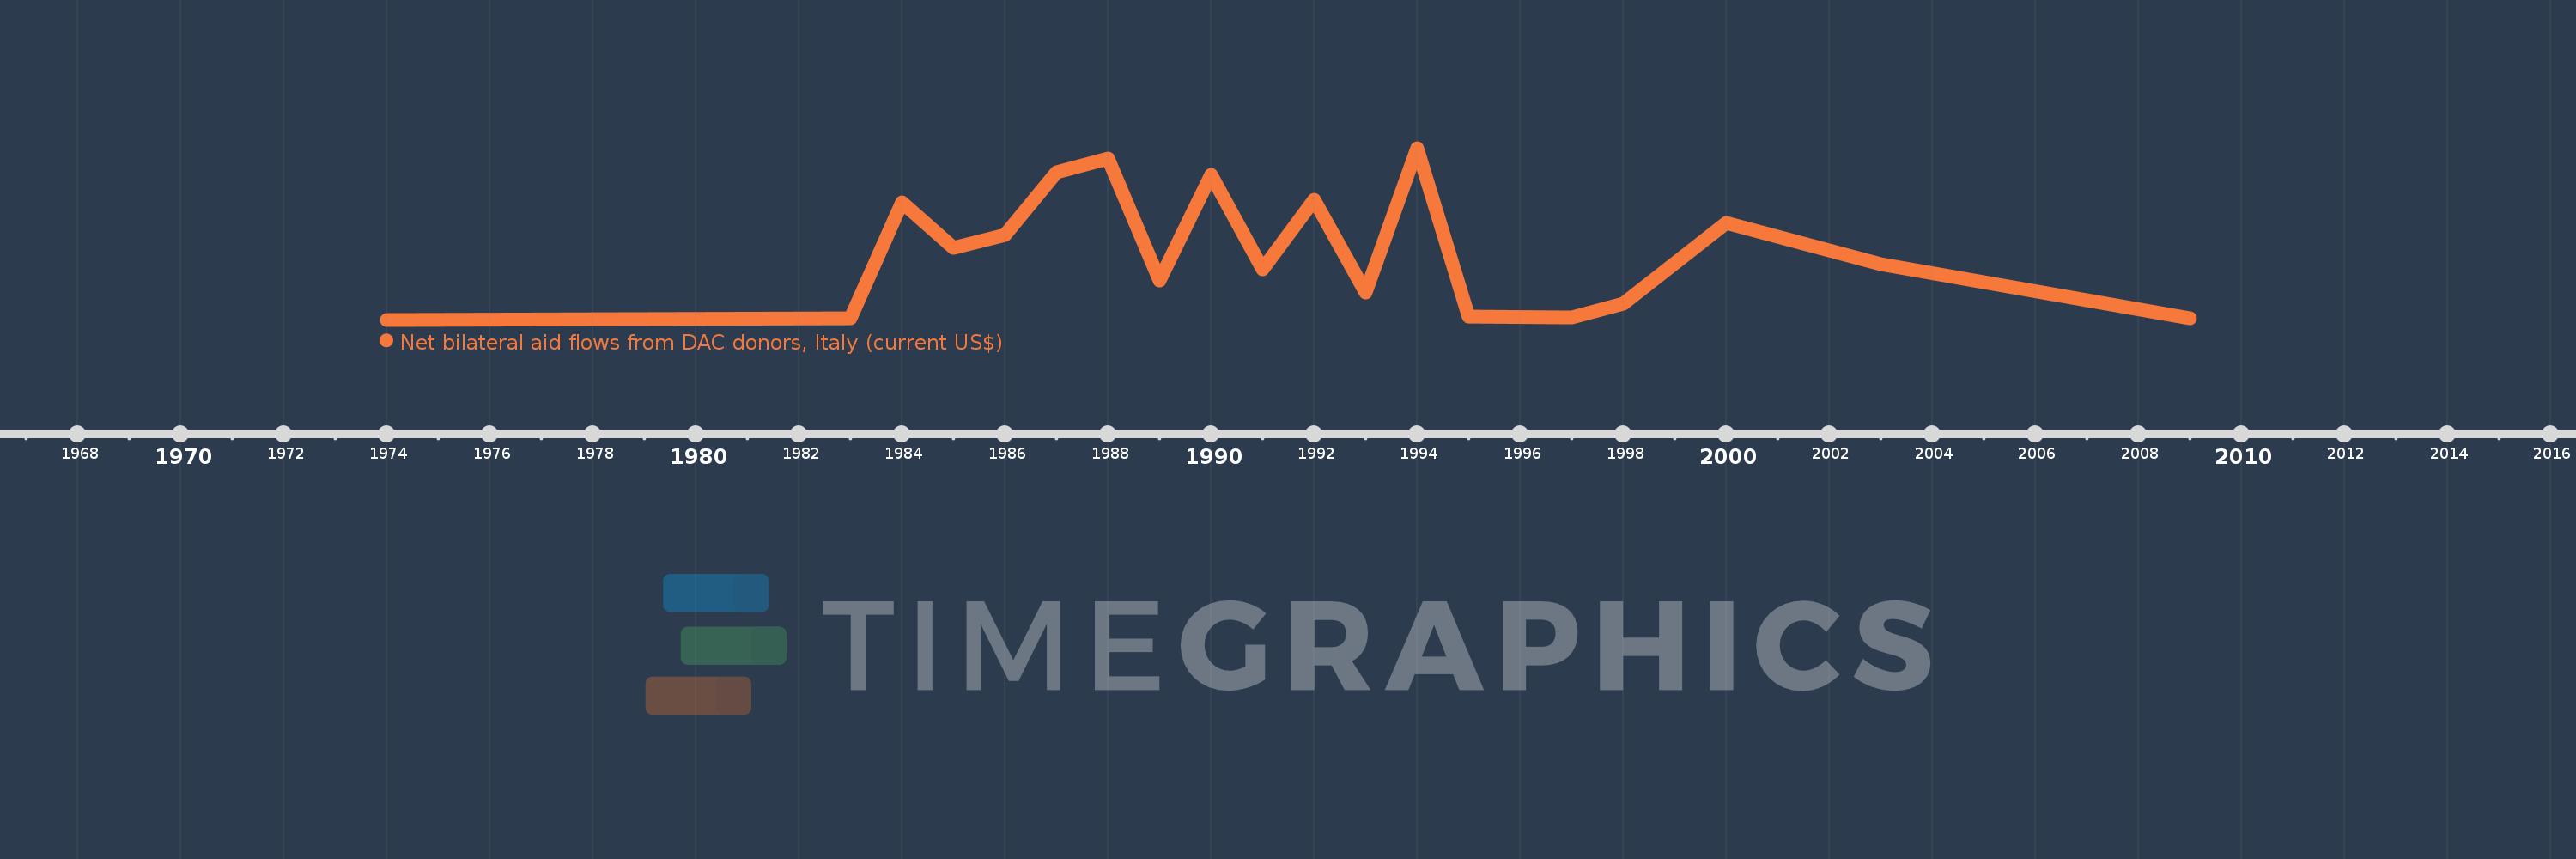
Questa scala temporale mostra un grafico dal 1974 anno al 2009 anno. Lesotho. I dati fino ad 1973 anno non disponibili. Il numero di osservazioni attuali secondo i date: 19.

La fonte (nome):

Indicatori dello sviluppo mondiale

La fonte (organizzazione):

Development Assistance Committee of the Organisation for Economic Co-operation and Development, Geographical Distribution of Financial Flows to Developing Countries, Development Co-operation Report, and International Development Statistics database. Data are available online at: www.oecd.org/dac/stats/idsonline.

Categorie:

Aid Effectiveness

sono stati aggiornati

23 apr 2017 anni

Indicatori delle variazioni dei valori per anni

In media:
596.842 Mille.
Minima:
10.0 Mille.
1 gen 1974 anni
Massimo:
1.47 Mln
1 gen 1994 anni
Alla data di osservazione
Valore
Variazione assoluta
La variazione rispetto al valore precedente
1 gen 1974 anni
10.0 Mille.
+10.0 Mille.
0.0%
1 gen 1983 anni
20.0 Mille.
+10.0 Mille.
100.0%
1 gen 1984 anni
1.01 Mln
+990.0 Mille.
4.95 Mille.%
1 gen 1985 anni
620.0 Mille.
-390.0 Mille.
-38.61%
1 gen 1986 anni
730.0 Mille.
+110.0 Mille.
17.74%
1 gen 1987 anni
1.26 Mln
+530.0 Mille.
72.6%
1 gen 1988 anni
1.38 Mln
+120.0 Mille.
9.52%
1 gen 1989 anni
340.0 Mille.
-1.04 Mln
-75.36%
1 gen 1990 anni
1.24 Mln
+900.0 Mille.
264.71%
1 gen 1991 anni
440.0 Mille.
-800.0 Mille.
-64.52%
1 gen 1992 anni
1.03 Mln
+590.0 Mille.
134.09%
1 gen 1993 anni
240.0 Mille.
-790.0 Mille.
-76.7%
1 gen 1994 anni
1.47 Mln
+1.23 Mln
512.5%
1 gen 1995 anni
40.0 Mille.
-1.43 Mln
-97.28%
1 gen 1997 anni
30.0 Mille.
-10.0 Mille.
-25.0%
1 gen 1998 anni
150.0 Mille.
+120.0 Mille.
400.0%
1 gen 2000 anni
830.0 Mille.
+680.0 Mille.
453.33%
1 gen 2003 anni
480.0 Mille.
-350.0 Mille.
-42.17%
1 gen 2009 anni
20.0 Mille.
-460.0 Mille.
-95.83%

Classificazione dei paesi secondo i statistiche attuali per anni