29
/it/
it
AIzaSyAYiBZKx7MnpbEhh9jyipgxe19OcubqV5w
April 1, 2024
115121
Croatia
HRV
true
2
1
Net bilateral aid flows from DAC donors, Italy (current US$)
2012,2011,2010,2009,2008,2007,2006,2005,2004,2003,2002,2001,2000,1999,1998,1997,1996,1995
Download
Biblioteca di statistiche globali →Croatia →

Net bilateral aid flows from DAC donors, Italy (current US$)

Queste statistiche in altri paesi:
AfghanistanAlbaniaAlgeriaAngolaAntigua and BarbudaArab WorldArgentinaArmeniaAzerbaijanBahamas, TheBangladeshBarbadosBelarusBelizeBeninBhutanBoliviaBosnia and HerzegovinaBotswanaBrazilBulgariaBurkina FasoBurundiCabo VerdeCambodiaCameroonCaribbean small statesCentral African RepublicCentral Europe and the BalticsChadChileChinaColombiaComorosCongo, Dem. Rep.Congo, Rep.Costa RicaCote d'IvoireCroatiaCubaCyprusCzech RepublicDjiboutiDominicaDominican RepublicEast Asia & PacificEast Asia & Pacific (excluding high income)East Asia & Pacific (IDA & IBRD countries)EcuadorEgypt, Arab Rep.El SalvadorEquatorial GuineaEritreaEstoniaEthiopiaEuro areaEurope & Central AsiaEurope & Central Asia (excluding high income)Europe & Central Asia (IDA & IBRD countries)European UnionFijiFragile and conflict affected situationsGabonGambia, TheGeorgiaGhanaGuatemalaGuineaGuinea-BissauGuyanaHaitiHeavily indebted poor countries (HIPC)High incomeHondurasHong Kong SAR, ChinaHungaryIBRD onlyIDA & IBRD totalIDA blendIDA onlyIDA totalIndiaIndonesiaIran, Islamic Rep.IraqIsraelJamaicaJordanKazakhstanKenyaKiribatiKorea, Dem. People’s Rep.Korea, Rep.KosovoKuwaitKyrgyz RepublicLao PDRLatin America & Caribbean Latin America & Caribbean (excluding high income)Latin America & the Caribbean (IDA & IBRD countries)LatviaLeast developed countries: UN classificationLebanonLesothoLiberiaLibyaLithuaniaLow & middle incomeLow incomeLower middle incomeMacedonia, FYRMadagascarMalawiMalaysiaMaldivesMaliMaltaMarshall IslandsMauritaniaMauritiusMexicoMiddle East & North AfricaMiddle East & North Africa (excluding high income)Middle East & North Africa (IDA & IBRD countries)Middle incomeMoldovaMongoliaMontenegroMoroccoMozambiqueMyanmarNamibiaNauruNepalNicaraguaNigerNigeriaOECD membersOmanOther small statesPacific island small statesPakistanPalauPanamaPapua New GuineaParaguayPeruPhilippinesPolandRomaniaRussian FederationRwandaSamoaSao Tome and PrincipeSaudi ArabiaSenegalSerbiaSeychellesSierra LeoneSingaporeSlovak RepublicSloveniaSmall statesSolomon IslandsSomaliaSouth AfricaSouth AsiaSouth Asia (IDA & IBRD)South SudanSri LankaSt. Kitts and NevisSt. LuciaSt. Vincent and the GrenadinesSub-Saharan Africa Sub-Saharan Africa (excluding high income)Sub-Saharan Africa (IDA & IBRD countries)SudanSurinameSwazilandSyrian Arab RepublicTajikistanTanzaniaThailandTimor-LesteTogoTongaTrinidad and TobagoTunisiaTurkeyTurkmenistanTuvaluUgandaUkraineUnited Arab EmiratesUpper middle incomeUruguayUzbekistanVanuatuVenezuela, RBVietnamWest Bank and GazaWorldYemen, Rep.ZambiaZimbabwe
Linea del tempo:
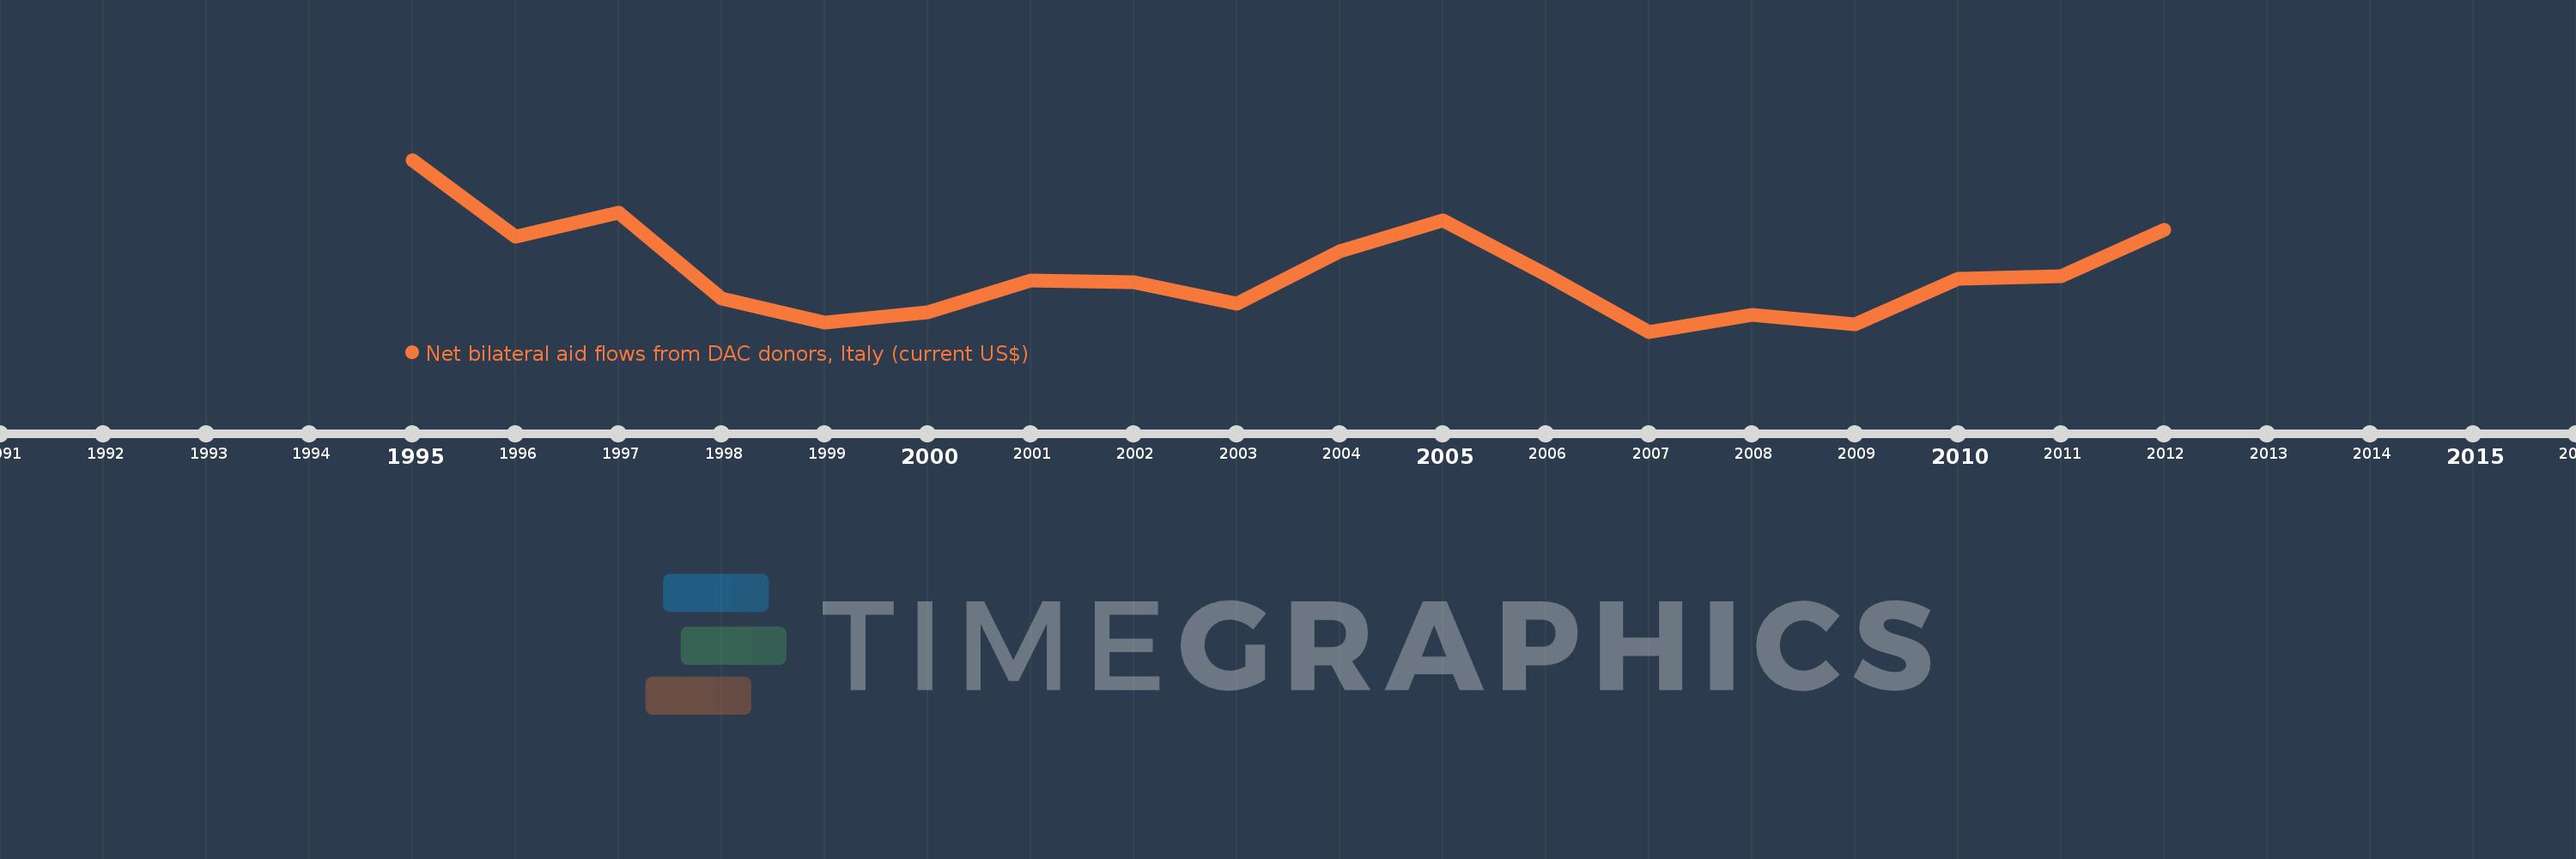
Questa scala temporale mostra un grafico dal 1995 anno al 2012 anno. Croatia. I dati fino ad 1994 anno non disponibili. Il numero di osservazioni attuali secondo i date: 18.
La fonte (nome):
Indicatori dello sviluppo mondiale
La fonte (organizzazione):
Development Assistance Committee of the Organisation for Economic Co-operation and Development, Geographical Distribution of Financial Flows to Developing Countries, Development Co-operation Report, and International Development Statistics database. Data are available online at: www.oecd.org/dac/stats/idsonline.
Categorie:
Aid Effectiveness
sono stati aggiornati
23 apr 2017 anni
Indicatori delle variazioni dei valori per anni
In media:
-1.476 Mln
Minima:
-3.89 Mln
1 gen 2007 anni
Massimo:
3.16 Mln
1 gen 1995 anni
Alla data di osservazione
Valore
Variazione assoluta
La variazione rispetto al valore precedente
1 gen 1995 anni
3.16 Mln
+3.16 Mln
0.0%
1 gen 1996 anni
20.0 Mille.
-3.14 Mln
-99.37%
1 gen 1997 anni
980.0 Mille.
+960.0 Mille.
4.8 Mille.%
1 gen 1998 anni
-2.54 Mln
-3.52 Mln
-359.18%
1 gen 1999 anni
-3.53 Mln
-990.0 Mille.
38.98%
1 gen 2000 anni
-3.08 Mln
+450.0 Mille.
-12.75%
1 gen 2001 anni
-1.8 Mln
+1.28 Mln
-41.56%
1 gen 2002 anni
-1.86 Mln
-60.0 Mille.
3.33%
1 gen 2003 anni
-2.75 Mln
-890.0 Mille.
47.85%
1 gen 2004 anni
-580.0 Mille.
+2.17 Mln
-78.91%
1 gen 2005 anni
670.0 Mille.
+1.25 Mln
-215.52%
1 gen 2006 anni
-1.53 Mln
-2.2 Mln
-328.36%
1 gen 2007 anni
-3.89 Mln
-2.36 Mln
154.25%
1 gen 2008 anni
-3.19 Mln
+700.0 Mille.
-17.99%
1 gen 2009 anni
-3.59 Mln
-400.0 Mille.
12.54%
1 gen 2010 anni
-1.72 Mln
+1.87 Mln
-52.09%
1 gen 2011 anni
-1.61 Mln
+110.0 Mille.
-6.4%
1 gen 2012 anni
280.0 Mille.
+1.89 Mln
-117.39%
Classificazione dei paesi secondo i statistiche attuali per anni

Commenti:

Inviare
PremiumAbout & FeedbackAccordoPrivatezza
logo
© 2022 Selected Technologies LLC – Morgan Hill, California