33
/it/
AIzaSyAYiBZKx7MnpbEhh9jyipgxe19OcubqV5w
August 1, 2025
138369
Georgia
GEO
true
2
1
Net bilateral aid flows from DAC donors, Italy (current US$)
2015,2014,2013,2012,2011,2010,2009,2008,2007,2006,2005,2004,2003,2002,2001,2000,1999,1998,1997,1996,1994
Download
Biblioteca di statistiche globali →Georgia →

Net bilateral aid flows from DAC donors, Italy (current US$)

Queste statistiche in altri paesi:

AfghanistanAlbaniaAlgeriaAngolaAntigua and BarbudaArab WorldArgentinaArmeniaAzerbaijanBahamas, TheBangladeshBarbadosBelarusBelizeBeninBhutanBoliviaBosnia and HerzegovinaBotswanaBrazilBulgariaBurkina FasoBurundiCabo VerdeCambodiaCameroonCaribbean small statesCentral African RepublicCentral Europe and the BalticsChadChileChinaColombiaComorosCongo, Dem. Rep.Congo, Rep.Costa RicaCote d'IvoireCroatiaCubaCyprusCzech RepublicDjiboutiDominicaDominican RepublicEast Asia & PacificEast Asia & Pacific (excluding high income)East Asia & Pacific (IDA & IBRD countries)EcuadorEgypt, Arab Rep.El SalvadorEquatorial GuineaEritreaEstoniaEthiopiaEuro areaEurope & Central AsiaEurope & Central Asia (excluding high income)Europe & Central Asia (IDA & IBRD countries)European UnionFijiFragile and conflict affected situationsGabonGambia, TheGeorgiaGhanaGuatemalaGuineaGuinea-BissauGuyanaHaitiHeavily indebted poor countries (HIPC)High incomeHondurasHong Kong SAR, ChinaHungaryIBRD onlyIDA & IBRD totalIDA blendIDA onlyIDA totalIndiaIndonesiaIran, Islamic Rep.IraqIsraelJamaicaJordanKazakhstanKenyaKiribatiKorea, Dem. People’s Rep.Korea, Rep.KosovoKuwaitKyrgyz RepublicLao PDRLatin America & Caribbean Latin America & Caribbean (excluding high income)Latin America & the Caribbean (IDA & IBRD countries)LatviaLeast developed countries: UN classificationLebanonLesothoLiberiaLibyaLithuaniaLow & middle incomeLow incomeLower middle incomeMacedonia, FYRMadagascarMalawiMalaysiaMaldivesMaliMaltaMarshall IslandsMauritaniaMauritiusMexicoMiddle East & North AfricaMiddle East & North Africa (excluding high income)Middle East & North Africa (IDA & IBRD countries)Middle incomeMoldovaMongoliaMontenegroMoroccoMozambiqueMyanmarNamibiaNauruNepalNicaraguaNigerNigeriaOECD membersOmanOther small statesPacific island small statesPakistanPalauPanamaPapua New GuineaParaguayPeruPhilippinesPolandRomaniaRussian FederationRwandaSamoaSao Tome and PrincipeSaudi ArabiaSenegalSerbiaSeychellesSierra LeoneSingaporeSlovak RepublicSloveniaSmall statesSolomon IslandsSomaliaSouth AfricaSouth AsiaSouth Asia (IDA & IBRD)South SudanSri LankaSt. Kitts and NevisSt. LuciaSt. Vincent and the GrenadinesSub-Saharan Africa Sub-Saharan Africa (excluding high income)Sub-Saharan Africa (IDA & IBRD countries)SudanSurinameSwazilandSyrian Arab RepublicTajikistanTanzaniaThailandTimor-LesteTogoTongaTrinidad and TobagoTunisiaTurkeyTurkmenistanTuvaluUgandaUkraineUnited Arab EmiratesUpper middle incomeUruguayUzbekistanVanuatuVenezuela, RBVietnamWest Bank and GazaWorldYemen, Rep.ZambiaZimbabwe

Linea del tempo:

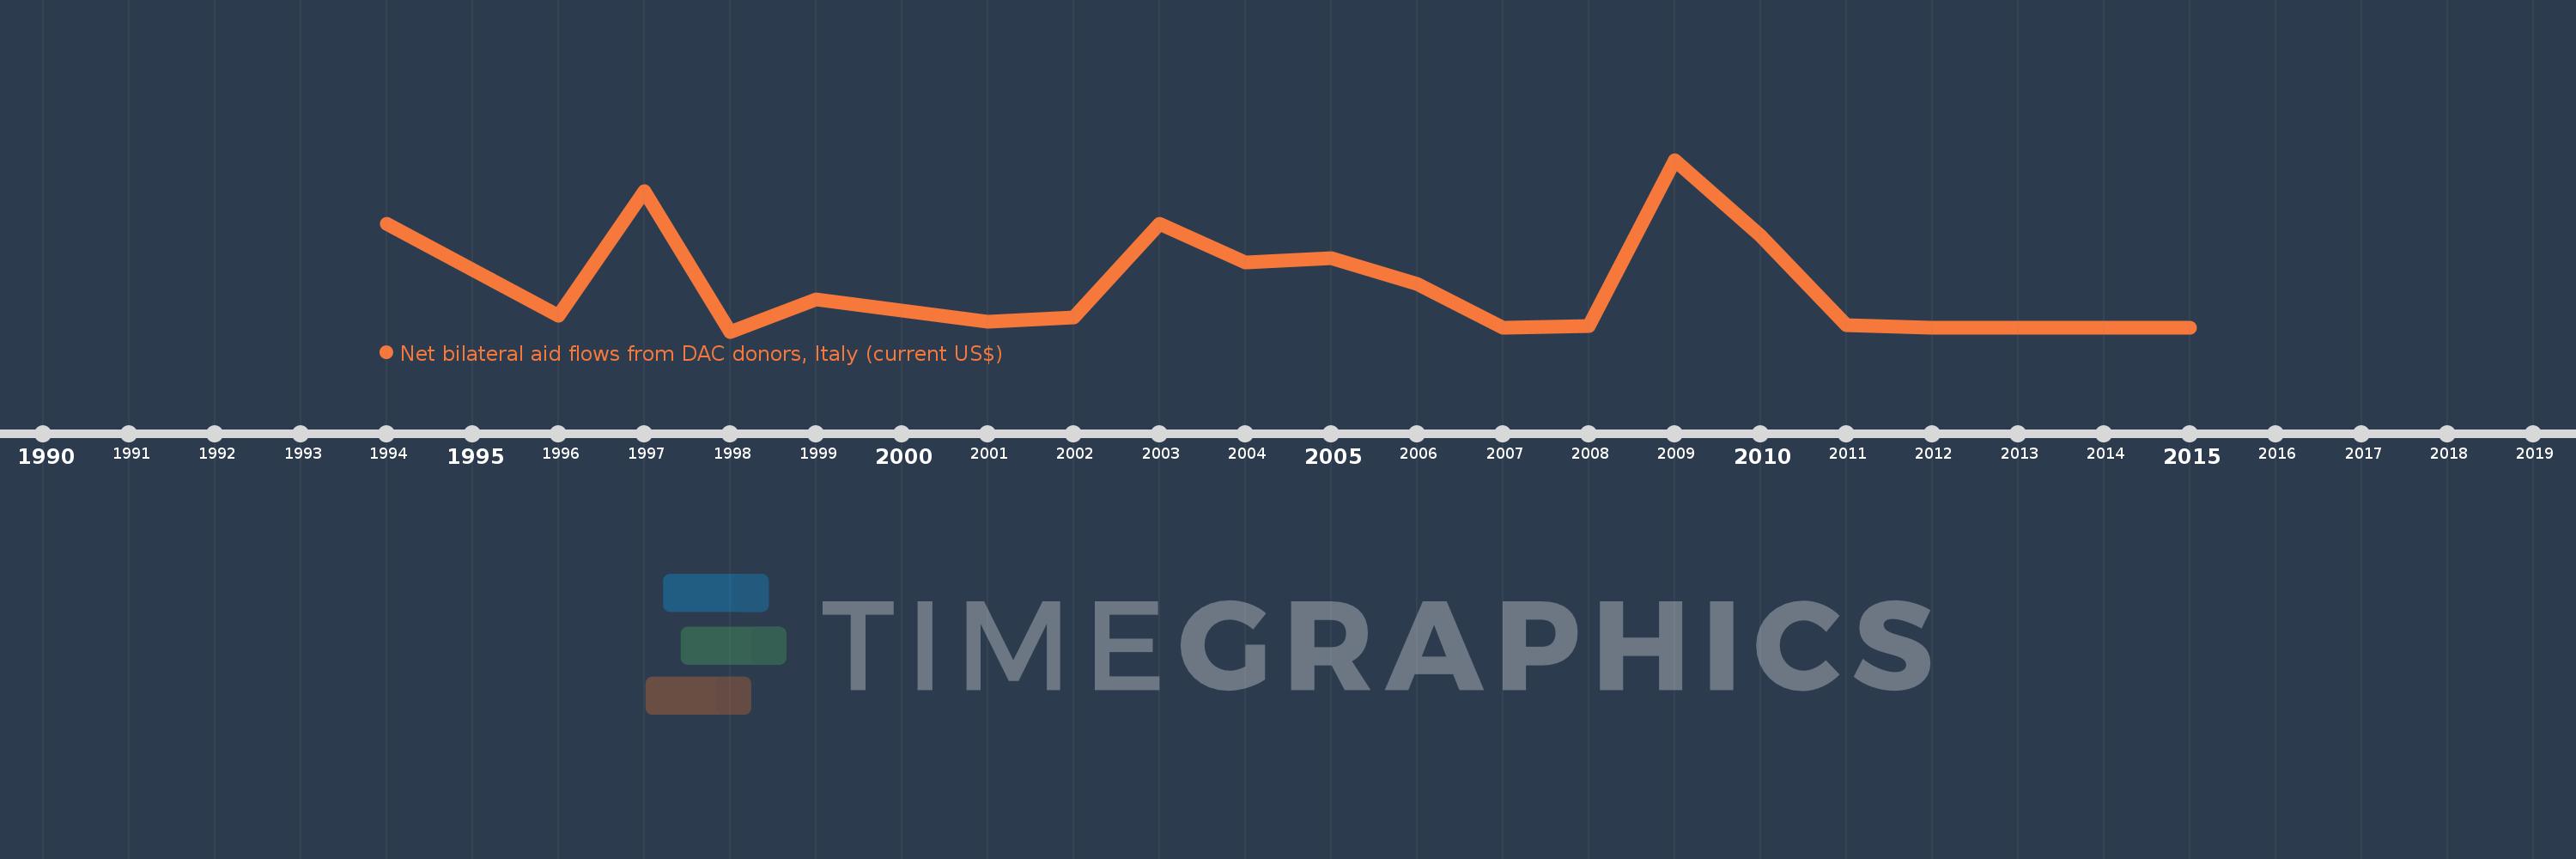
Questa scala temporale mostra un grafico dal 1994 anno al 2015 anno. Georgia. I dati fino ad 1993 anno non disponibili. Il numero di osservazioni attuali secondo i date: 21.

La fonte (nome):

Indicatori dello sviluppo mondiale

La fonte (organizzazione):

Development Assistance Committee of the Organisation for Economic Co-operation and Development, Geographical Distribution of Financial Flows to Developing Countries, Development Co-operation Report, and International Development Statistics database. Data are available online at: www.oecd.org/dac/stats/idsonline.

Categorie:

Aid Effectiveness

sono stati aggiornati

23 apr 2017 anni

Indicatori delle variazioni dei valori per anni

In media:
1.177 Mln
Minima:
20.0 Mille.
1 gen 1998 anni
Massimo:
4.48 Mln
1 gen 2009 anni
Alla data di osservazione
Valore
Variazione assoluta
La variazione rispetto al valore precedente
1 gen 1994 anni
2.81 Mln
+2.81 Mln
0.0%
1 gen 1996 anni
440.0 Mille.
-2.37 Mln
-84.34%
1 gen 1997 anni
3.67 Mln
+3.23 Mln
734.09%
1 gen 1998 anni
20.0 Mille.
-3.65 Mln
-99.46%
1 gen 1999 anni
860.0 Mille.
+840.0 Mille.
4.2 Mille.%
1 gen 2000 anni
560.0 Mille.
-300.0 Mille.
-34.88%
1 gen 2001 anni
270.0 Mille.
-290.0 Mille.
-51.79%
1 gen 2002 anni
390.0 Mille.
+120.0 Mille.
44.44%
1 gen 2003 anni
2.81 Mln
+2.42 Mln
620.51%
1 gen 2004 anni
1.81 Mln
-1000.0 Mille.
-35.59%
1 gen 2005 anni
1.92 Mln
+110.0 Mille.
6.08%
1 gen 2006 anni
1.26 Mln
-660.0 Mille.
-34.38%
1 gen 2007 anni
110.0 Mille.
-1.15 Mln
-91.27%
1 gen 2008 anni
160.0 Mille.
+50.0 Mille.
45.45%
1 gen 2009 anni
4.48 Mln
+4.32 Mln
2.7 Mille.%
1 gen 2010 anni
2.51 Mln
-1.97 Mln
-43.97%
1 gen 2011 anni
180.0 Mille.
-2.33 Mln
-92.83%
1 gen 2012 anni
110.0 Mille.
-70.0 Mille.
-38.89%
1 gen 2013 anni
120.0 Mille.
+10.0 Mille.
9.09%
1 gen 2014 anni
110.0 Mille.
-10.0 Mille.
-8.33%
1 gen 2015 anni
110.0 Mille.
0.0
0.0%

Classificazione dei paesi secondo i statistiche attuali per anni