30
/it/
AIzaSyAYiBZKx7MnpbEhh9jyipgxe19OcubqV5w
April 1, 2024
108804
Comoros
COM
true
2
1
Net bilateral aid flows from DAC donors, Italy (current US$)
2015,2012,2008,2005,1999,1995,1994,1990,1989,1988,1985,1984,1982,1981,1980,1979,1978
Download
Biblioteca di statistiche globali →Comoros →

Net bilateral aid flows from DAC donors, Italy (current US$)

Queste statistiche in altri paesi:

AfghanistanAlbaniaAlgeriaAngolaAntigua and BarbudaArab WorldArgentinaArmeniaAzerbaijanBahamas, TheBangladeshBarbadosBelarusBelizeBeninBhutanBoliviaBosnia and HerzegovinaBotswanaBrazilBulgariaBurkina FasoBurundiCabo VerdeCambodiaCameroonCaribbean small statesCentral African RepublicCentral Europe and the BalticsChadChileChinaColombiaComorosCongo, Dem. Rep.Congo, Rep.Costa RicaCote d'IvoireCroatiaCubaCyprusCzech RepublicDjiboutiDominicaDominican RepublicEast Asia & PacificEast Asia & Pacific (excluding high income)East Asia & Pacific (IDA & IBRD countries)EcuadorEgypt, Arab Rep.El SalvadorEquatorial GuineaEritreaEstoniaEthiopiaEuro areaEurope & Central AsiaEurope & Central Asia (excluding high income)Europe & Central Asia (IDA & IBRD countries)European UnionFijiFragile and conflict affected situationsGabonGambia, TheGeorgiaGhanaGuatemalaGuineaGuinea-BissauGuyanaHaitiHeavily indebted poor countries (HIPC)High incomeHondurasHong Kong SAR, ChinaHungaryIBRD onlyIDA & IBRD totalIDA blendIDA onlyIDA totalIndiaIndonesiaIran, Islamic Rep.IraqIsraelJamaicaJordanKazakhstanKenyaKiribatiKorea, Dem. People’s Rep.Korea, Rep.KosovoKuwaitKyrgyz RepublicLao PDRLatin America & Caribbean Latin America & Caribbean (excluding high income)Latin America & the Caribbean (IDA & IBRD countries)LatviaLeast developed countries: UN classificationLebanonLesothoLiberiaLibyaLithuaniaLow & middle incomeLow incomeLower middle incomeMacedonia, FYRMadagascarMalawiMalaysiaMaldivesMaliMaltaMarshall IslandsMauritaniaMauritiusMexicoMiddle East & North AfricaMiddle East & North Africa (excluding high income)Middle East & North Africa (IDA & IBRD countries)Middle incomeMoldovaMongoliaMontenegroMoroccoMozambiqueMyanmarNamibiaNauruNepalNicaraguaNigerNigeriaOECD membersOmanOther small statesPacific island small statesPakistanPalauPanamaPapua New GuineaParaguayPeruPhilippinesPolandRomaniaRussian FederationRwandaSamoaSao Tome and PrincipeSaudi ArabiaSenegalSerbiaSeychellesSierra LeoneSingaporeSlovak RepublicSloveniaSmall statesSolomon IslandsSomaliaSouth AfricaSouth AsiaSouth Asia (IDA & IBRD)South SudanSri LankaSt. Kitts and NevisSt. LuciaSt. Vincent and the GrenadinesSub-Saharan Africa Sub-Saharan Africa (excluding high income)Sub-Saharan Africa (IDA & IBRD countries)SudanSurinameSwazilandSyrian Arab RepublicTajikistanTanzaniaThailandTimor-LesteTogoTongaTrinidad and TobagoTunisiaTurkeyTurkmenistanTuvaluUgandaUkraineUnited Arab EmiratesUpper middle incomeUruguayUzbekistanVanuatuVenezuela, RBVietnamWest Bank and GazaWorldYemen, Rep.ZambiaZimbabwe

Linea del tempo:

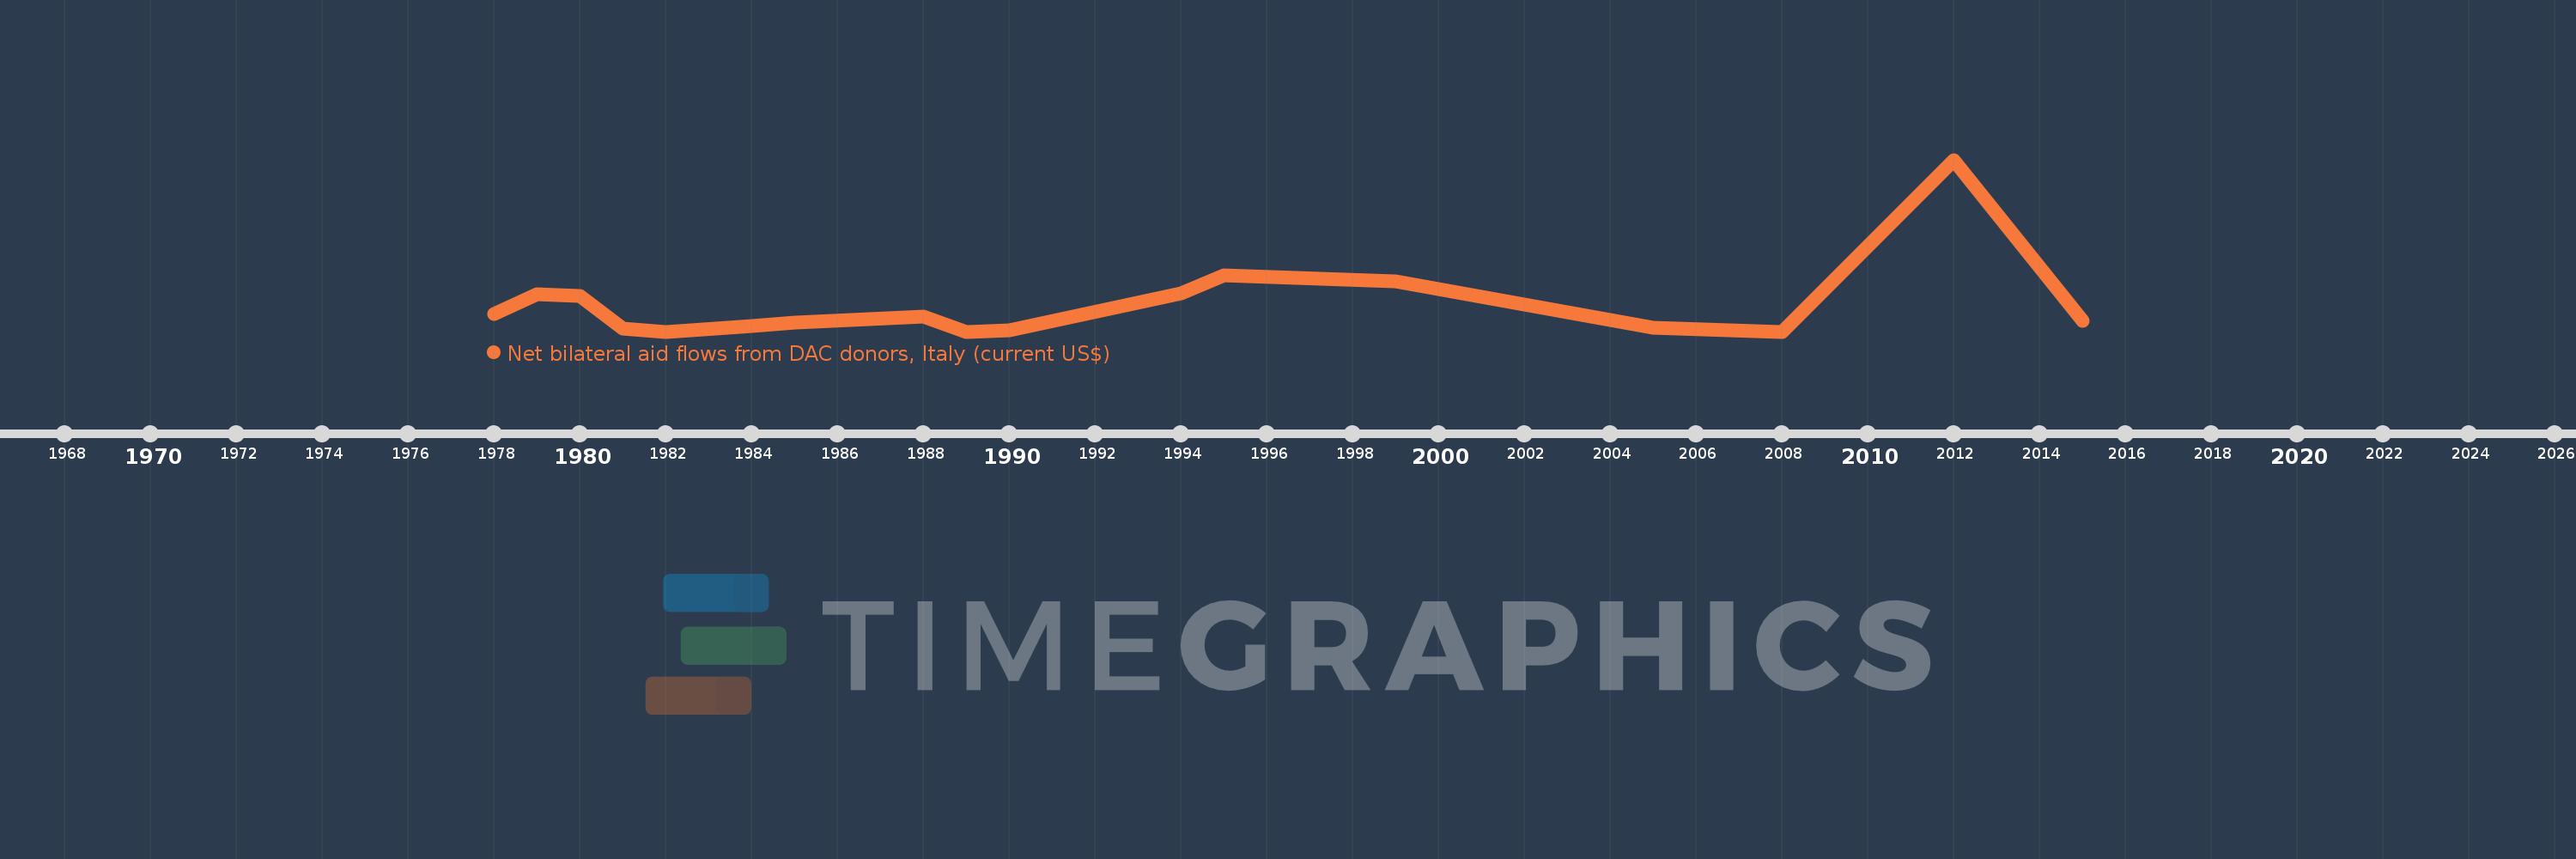
Questa scala temporale mostra un grafico dal 1978 anno al 2015 anno. Comoros. I dati fino ad 1977 anno non disponibili. Il numero di osservazioni attuali secondo i date: 17.

La fonte (nome):

Indicatori dello sviluppo mondiale

La fonte (organizzazione):

Development Assistance Committee of the Organisation for Economic Co-operation and Development, Geographical Distribution of Financial Flows to Developing Countries, Development Co-operation Report, and International Development Statistics database. Data are available online at: www.oecd.org/dac/stats/idsonline.

Categorie:

Aid Effectiveness

sono stati aggiornati

23 apr 2017 anni

Indicatori delle variazioni dei valori per anni

In media:
211.176 Mille.
Minima:
10.0 Mille.
1 gen 1982 anni
Massimo:
1.3 Mln
1 gen 2012 anni
Alla data di osservazione
Valore
Variazione assoluta
La variazione rispetto al valore precedente
1 gen 1978 anni
140.0 Mille.
+140.0 Mille.
0.0%
1 gen 1979 anni
290.0 Mille.
+150.0 Mille.
107.14%
1 gen 1980 anni
280.0 Mille.
-10.0 Mille.
-3.45%
1 gen 1981 anni
30.0 Mille.
-250.0 Mille.
-89.29%
1 gen 1982 anni
10.0 Mille.
-20.0 Mille.
-66.67%
1 gen 1984 anni
50.0 Mille.
+40.0 Mille.
400.0%
1 gen 1985 anni
80.0 Mille.
+30.0 Mille.
60.0%
1 gen 1988 anni
120.0 Mille.
+40.0 Mille.
50.0%
1 gen 1989 anni
10.0 Mille.
-110.0 Mille.
-91.67%
1 gen 1990 anni
20.0 Mille.
+10.0 Mille.
100.0%
1 gen 1994 anni
300.0 Mille.
+280.0 Mille.
1.4 Mille.%
1 gen 1995 anni
430.0 Mille.
+130.0 Mille.
43.33%
1 gen 1999 anni
390.0 Mille.
-40.0 Mille.
-9.3%
1 gen 2005 anni
40.0 Mille.
-350.0 Mille.
-89.74%
1 gen 2008 anni
10.0 Mille.
-30.0 Mille.
-75.0%
1 gen 2012 anni
1.3 Mln
+1.29 Mln
12.9 Mille.%
1 gen 2015 anni
90.0 Mille.
-1.21 Mln
-93.08%

Classificazione dei paesi secondo i statistiche attuali per anni