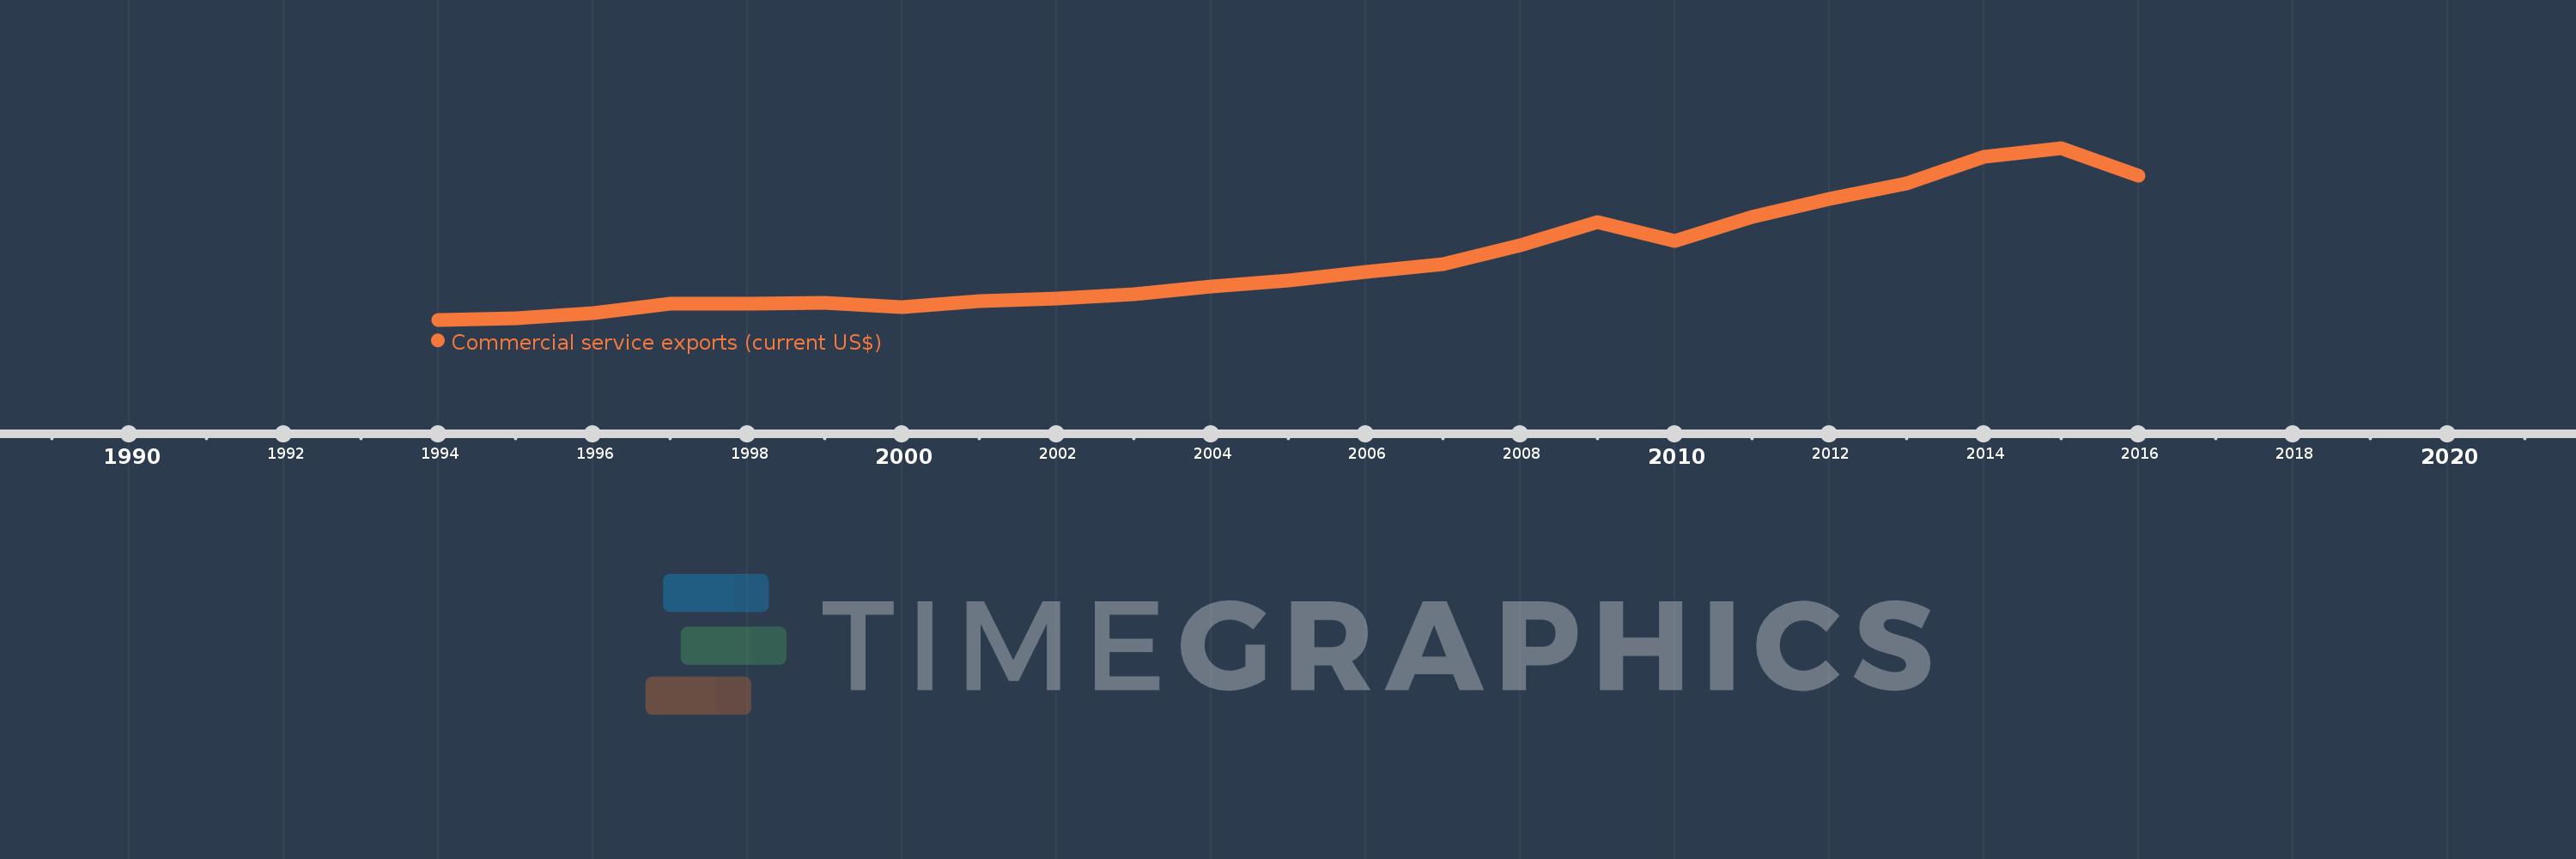
Cette échelle de temps montre un graphique de 1994 année à 2016 année Belarus. Les données jusqu'à 1993 année ne sont pas présentés. Quantité d'observations actuelles selon dates: 23.
Source (désignation):
Les indicateurs du développement mondiale
Source (organisation):
International Monetary Fund, Balance of Payments Statistics Yearbook and data files.
Catégories:
Private Sector, Trade
Dernière mise à jour
23 avr. 2017
Les indicateurs de changement de valeurs selon les années
En moyenne:
2.903 mds
Minimum:
184.9 mln.
1 janv. 1994
Maximum:
7.843 mds
1 janv. 2015
Pour la date d''observation
Valeur
Changement absolu
Le changement par rapport à la valeur précédente
1 janv. 1994
184.9 mln.
+184.9 mln.
0.0%
1 janv. 1995
251.4 mln.
+66.5 mln.
35.97%
1 janv. 1996
465.9 mln.
+214.5 mln.
85.32%
1 janv. 1997
907.2 mln.
+441.3 mln.
94.72%
1 janv. 1998
918.5 mln.
+11.3 mln.
1.25%
1 janv. 1999
934.0 mln.
+15.5 mln.
1.69%
1 janv. 2000
746.5 mln.
-187.5 mln.
-20.07%
1 janv. 2001
1.001 mds
+254.4 mln.
34.08%
1 janv. 2002
1.132 mds
+131.5 mln.
13.14%
1 janv. 2003
1.329 mds
+196.9 mln.
17.39%
1 janv. 2004
1.681 mds
+352.1 mln.
26.49%
1 janv. 2005
1.941 mds
+260.0 mln.
15.46%
1 janv. 2006
2.325 mds
+383.4 mln.
19.75%
1 janv. 2007
2.657 mds
+332.5 mln.
14.3%
1 janv. 2008
3.522 mds
+864.5 mln.
32.53%
1 janv. 2009
4.553 mds
+1.032 mds
29.29%
1 janv. 2010
3.683 mds
-870.0 mln.
-19.11%
1 janv. 2011
4.761 mds
+1.078 mds
29.26%
1 janv. 2012
5.573 mds
+811.8 mln.
17.05%
1 janv. 2013
6.276 mds
+702.7 mln.
12.61%
1 janv. 2014
7.466 mds
+1.19 mds
18.96%
1 janv. 2015
7.843 mds
+377.7 mln.
5.06%
1 janv. 2016
6.618 mds
-1.226 mds
-15.63%
Classement des pays selon les statistiques actuelles par années