30
/fr/
AIzaSyAYiBZKx7MnpbEhh9jyipgxe19OcubqV5w
April 1, 2024
286955
Zimbabwe
ZWE
true
2
1
Commercial service exports (current US$)
2016,2015,2014,2013,2012,2011,2010,1995,1994,1993,1992,1991,1990,1989,1988,1987,1986,1985,1984,1983,1982,1981,1980,1979,1978
Download
Bibliothèque de statistiques globales →Zimbabwe →

Commercial service exports (current US$)

Cette statistique dans les autres pays:

AfghanistanAlbaniaAlgeriaAngolaAntigua and BarbudaArab WorldArgentinaArmeniaArubaAustraliaAustriaAzerbaijanBahamas, TheBahrainBangladeshBarbadosBelarusBelgiumBelizeBeninBermudaBhutanBoliviaBosnia and HerzegovinaBotswanaBrazilBrunei DarussalamBulgariaBurkina FasoBurundiCabo VerdeCambodiaCameroonCanadaCaribbean small statesCentral African RepublicCentral Europe and the BalticsChadChileChinaColombiaComorosCongo, Dem. Rep.Congo, Rep.Costa RicaCote d'IvoireCroatiaCuracaoCyprusCzech RepublicDenmarkDjiboutiDominicaDominican RepublicEarly-demographic dividendEast Asia & PacificEast Asia & Pacific (excluding high income)East Asia & Pacific (IDA & IBRD countries)EcuadorEgypt, Arab Rep.El SalvadorEquatorial GuineaEritreaEstoniaEthiopiaEuro areaEurope & Central AsiaEurope & Central Asia (excluding high income)Europe & Central Asia (IDA & IBRD countries)European UnionFaroe IslandsFijiFinlandFragile and conflict affected situationsFranceFrench PolynesiaGabonGambia, TheGeorgiaGermanyGhanaGreeceGrenadaGuatemalaGuineaGuinea-BissauGuyanaHaitiHeavily indebted poor countries (HIPC)High incomeHondurasHong Kong SAR, ChinaHungaryIBRD onlyIcelandIDA & IBRD totalIDA blendIDA onlyIDA totalIndiaIndonesiaIran, Islamic Rep.IraqIrelandIsraelItalyJamaicaJapanJordanKazakhstanKenyaKiribatiKorea, Rep.KosovoKuwaitKyrgyz RepublicLao PDRLate-demographic dividendLatin America & Caribbean Latin America & Caribbean (excluding high income)Latin America & the Caribbean (IDA & IBRD countries)LatviaLeast developed countries: UN classificationLebanonLesothoLiberiaLibyaLithuaniaLow & middle incomeLow incomeLower middle incomeLuxembourgMacao SAR, ChinaMacedonia, FYRMadagascarMalawiMalaysiaMaldivesMaliMaltaMarshall IslandsMauritaniaMauritiusMexicoMicronesia, Fed. Sts.Middle East & North Africa (excluding high income)Middle East & North Africa (IDA & IBRD countries)Middle incomeMoldovaMongoliaMontenegroMoroccoMozambiqueMyanmarNamibiaNepalNetherlandsNew CaledoniaNew ZealandNicaraguaNigerNigeriaNorth AmericaNorwayOECD membersOmanPacific island small statesPakistanPalauPanamaPapua New GuineaParaguayPeruPhilippinesPolandPortugalPost-demographic dividendPre-demographic dividendQatarRomaniaRussian FederationRwandaSamoaSao Tome and PrincipeSaudi ArabiaSenegalSerbiaSeychellesSierra LeoneSingaporeSint Maarten (Dutch part)Slovak RepublicSloveniaSolomon IslandsSouth AfricaSouth AsiaSouth Asia (IDA & IBRD)South SudanSpainSri LankaSt. Kitts and NevisSt. LuciaSt. Vincent and the GrenadinesSub-Saharan Africa Sub-Saharan Africa (excluding high income)Sub-Saharan Africa (IDA & IBRD countries)SudanSurinameSwazilandSwedenSwitzerlandSyrian Arab RepublicTajikistanTanzaniaThailandTimor-LesteTogoTongaTrinidad and TobagoTunisiaTurkeyTuvaluUgandaUkraineUnited KingdomUnited StatesUpper middle incomeUruguayVanuatuVenezuela, RBVietnamWest Bank and GazaWorldYemen, Rep.ZambiaZimbabwe

La ligne de temps

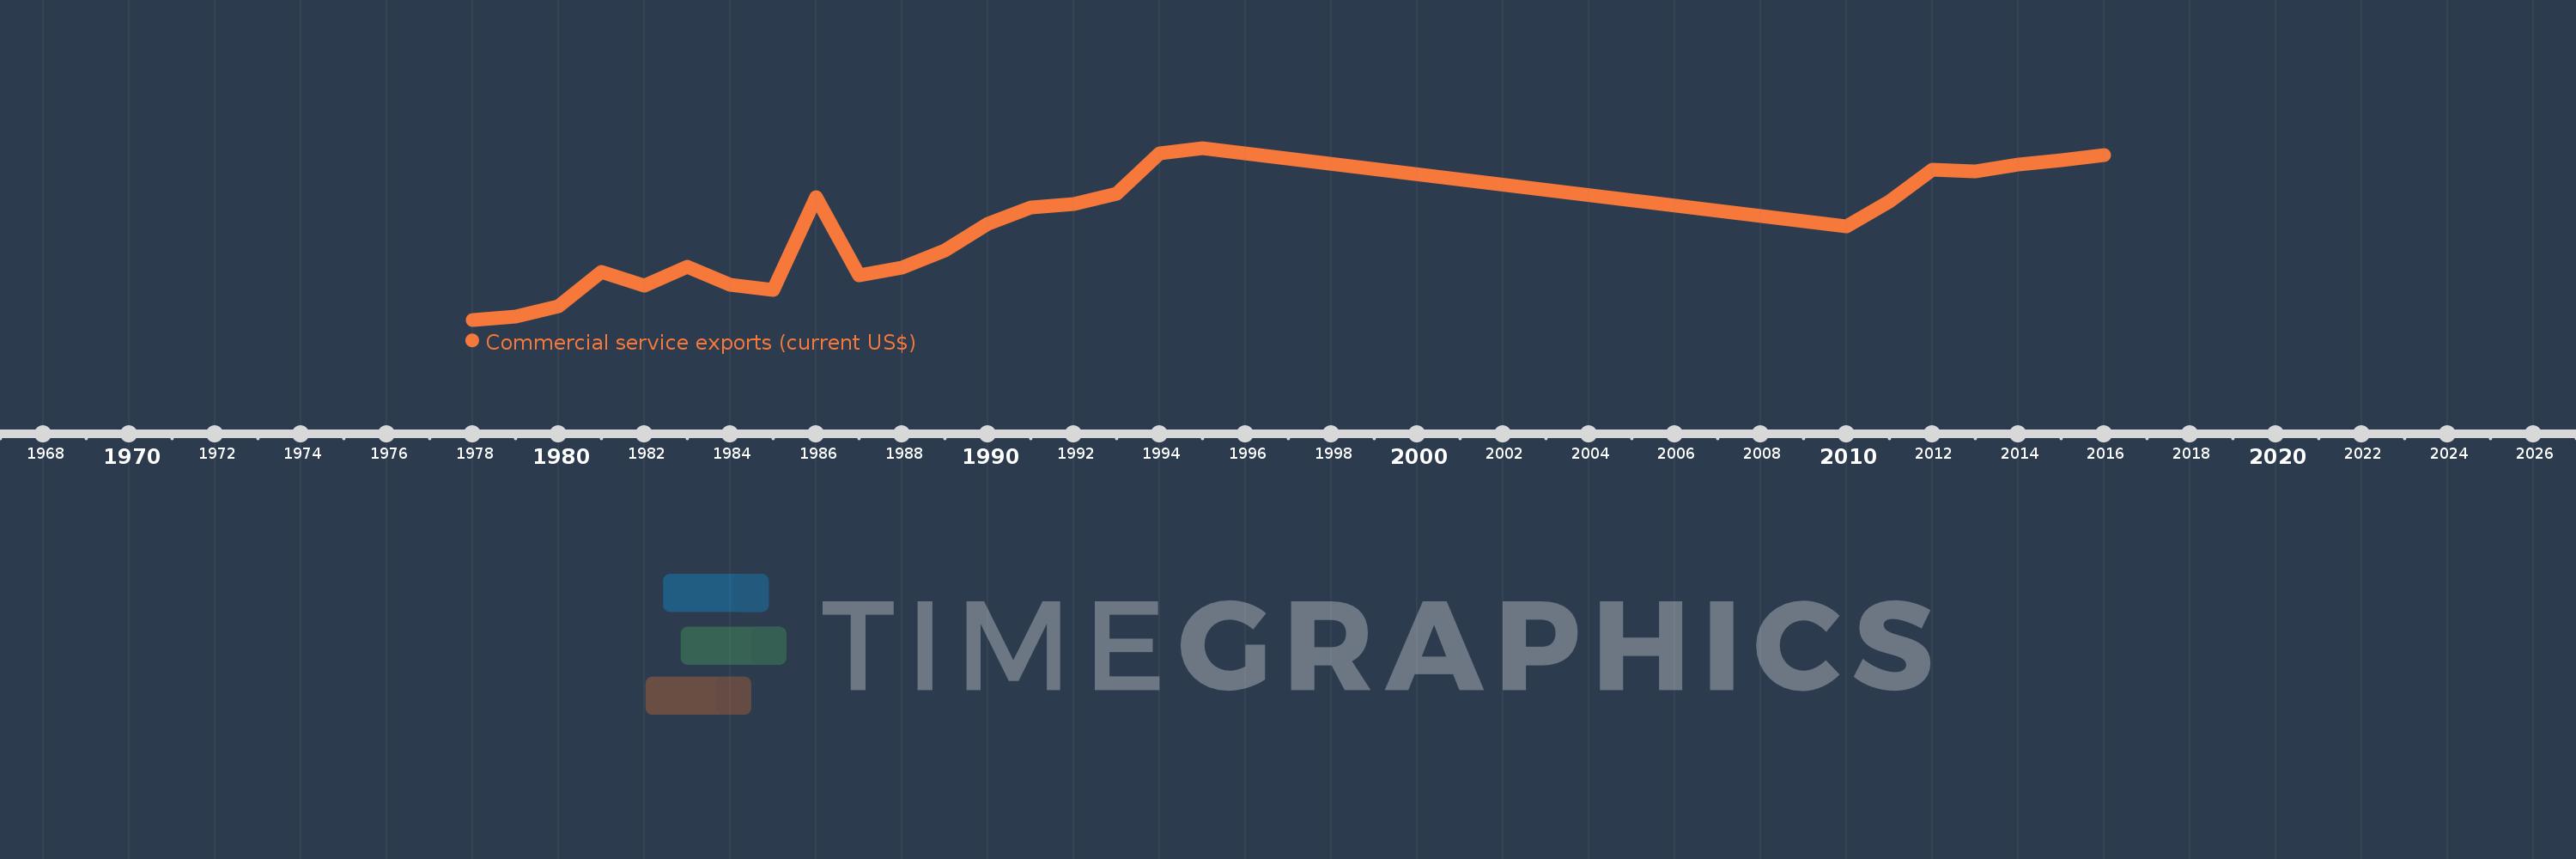
Cette échelle de temps montre un graphique de 1978 année à 2016 année Zimbabwe. Les données jusqu'à 1977 année ne sont pas présentés. Quantité d'observations actuelles selon dates: 25.

Source (désignation):

Les indicateurs du développement mondiale

Source (organisation):

International Monetary Fund, Balance of Payments Statistics Yearbook and data files.

Catégories:

Private Sector, Trade

Dernière mise à jour

23 avr. 2017

Les indicateurs de changement de valeurs selon les années

En moyenne:
217.884 mln.
Minimum:
64.381 mln.
1 janv. 1978
Maximum:
353.097 mln.
1 janv. 1995
Pour la date d''observation
Valeur
Changement absolu
Le changement par rapport à la valeur précédente
1 janv. 1978
64.381 mln.
+64.381 mln.
0.0%
1 janv. 1979
69.055 mln.
+4.674 mln.
7.26%
1 janv. 1980
87.142 mln.
+18.087 mln.
26.19%
1 janv. 1981
144.431 mln.
+57.289 mln.
65.74%
1 janv. 1982
121.941 mln.
-22.49 mln.
-15.57%
1 janv. 1983
153.727 mln.
+31.786 mln.
26.07%
1 janv. 1984
123.416 mln.
-30.312 mln.
-19.72%
1 janv. 1985
115.034 mln.
-8.381 mln.
-6.79%
1 janv. 1986
271.008 mln.
+155.974 mln.
135.59%
1 janv. 1987
139.171 mln.
-131.838 mln.
-48.65%
1 janv. 1988
151.821 mln.
+12.651 mln.
9.09%
1 janv. 1989
181.443 mln.
+29.621 mln.
19.51%
1 janv. 1990
225.88 mln.
+44.437 mln.
24.49%
1 janv. 1991
253.123 mln.
+27.244 mln.
12.06%
1 janv. 1992
258.982 mln.
+5.858 mln.
2.31%
1 janv. 1993
276.357 mln.
+17.375 mln.
6.71%
1 janv. 1994
344.53 mln.
+68.173 mln.
24.67%
1 janv. 1995
353.097 mln.
+8.567 mln.
2.49%
1 janv. 2010
221.527 mln.
-131.571 mln.
-37.26%
1 janv. 2011
263.127 mln.
+41.6 mln.
18.78%
1 janv. 2012
316.112 mln.
+52.985 mln.
20.14%
1 janv. 2013
313.179 mln.
-2.933 mln.
-0.93%
1 janv. 2014
324.957 mln.
+11.777 mln.
3.76%
1 janv. 2015
332.982 mln.
+8.025 mln.
2.47%
1 janv. 2016
340.688 mln.
+7.706 mln.
2.31%

Classement des pays selon les statistiques actuelles par années