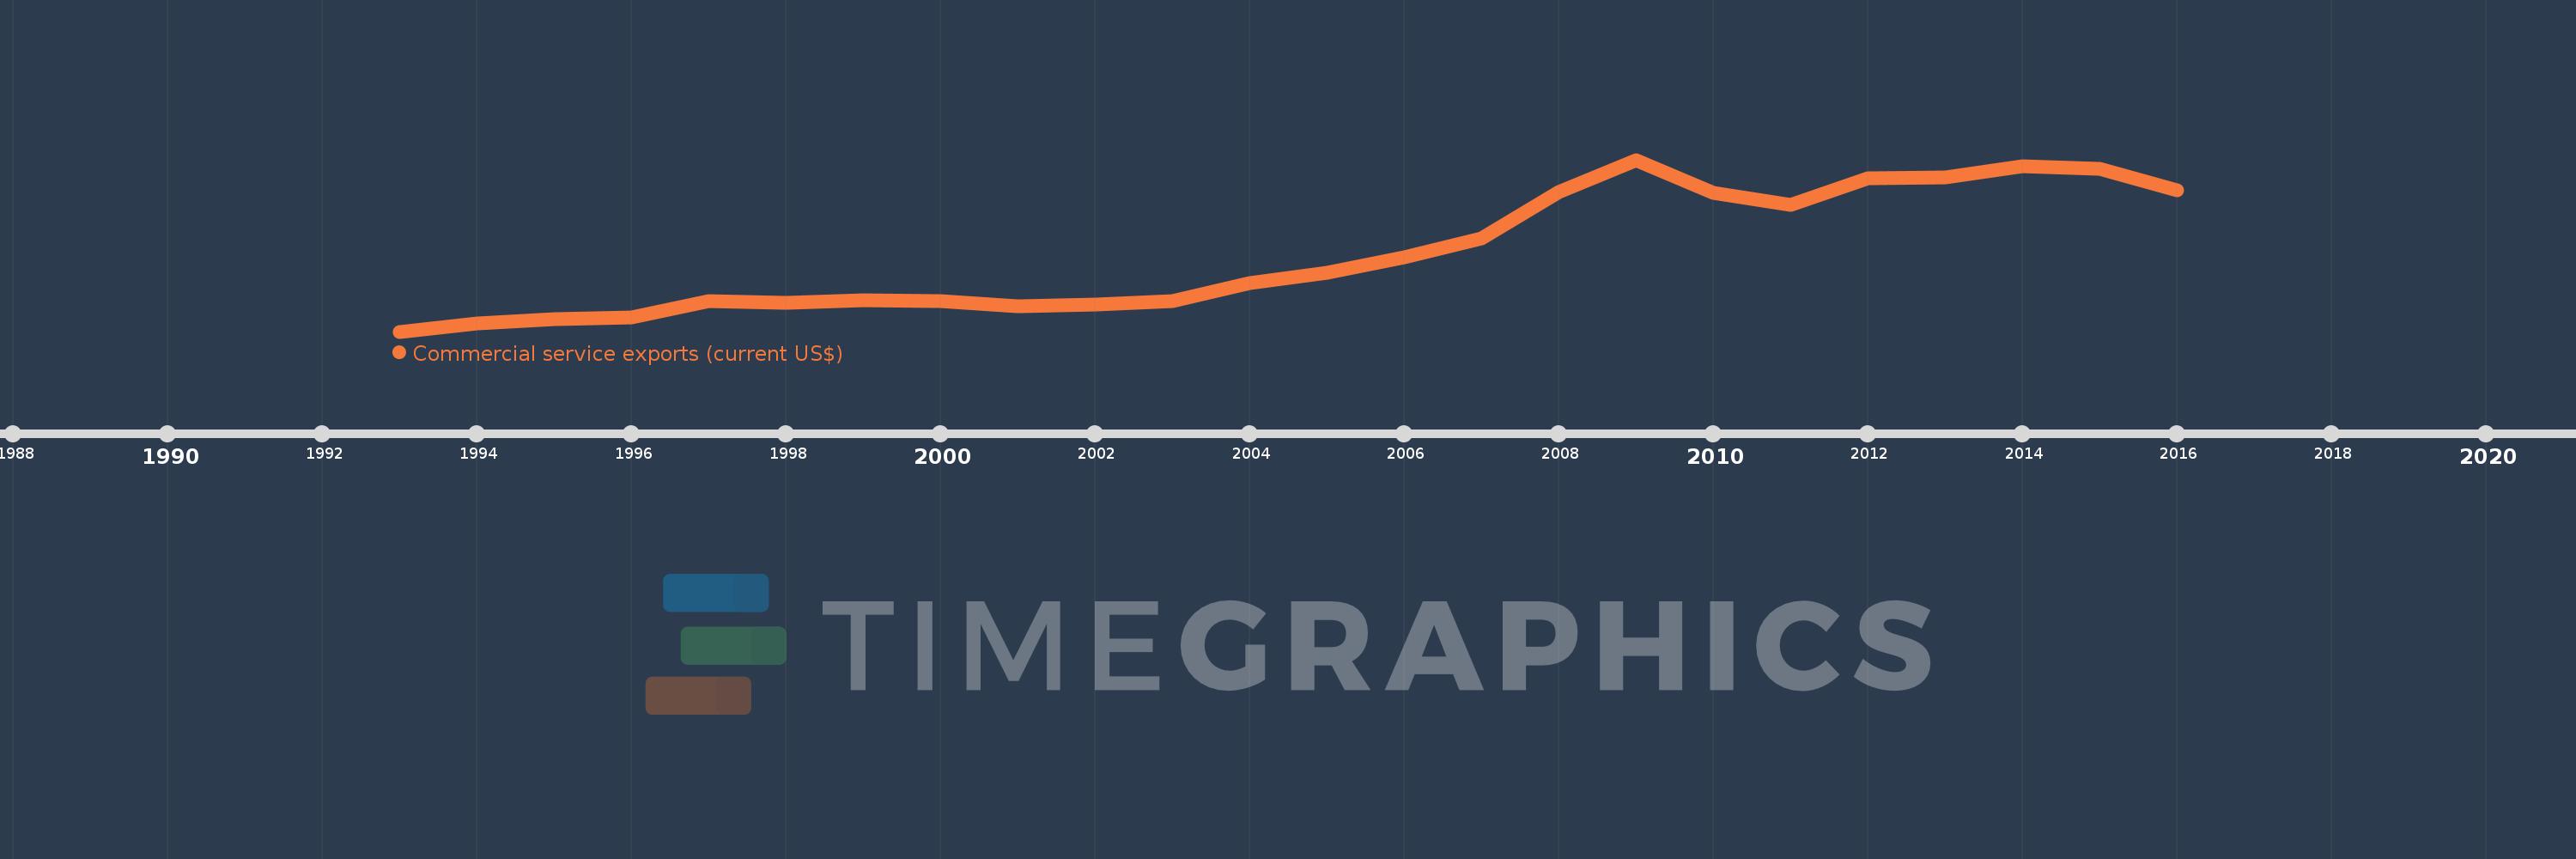
Cette échelle de temps montre un graphique de 1993 année à 2016 année Latvia. Les données jusqu'à 1992 année ne sont pas présentés. Quantité d'observations actuelles selon dates: 24.
Source (désignation):
Les indicateurs du développement mondiale
Source (organisation):
International Monetary Fund, Balance of Payments Statistics Yearbook and data files.
Catégories:
Private Sector, Trade
Dernière mise à jour
23 avr. 2017
Les indicateurs de changement de valeurs selon les années
En moyenne:
2.571 mds
Minimum:
289.83 mln.
1 janv. 1993
Maximum:
5.327 mds
1 janv. 2009
Pour la date d''observation
Valeur
Changement absolu
Le changement par rapport à la valeur précédente
1 janv. 1993
289.83 mln.
+289.83 mln.
0.0%
1 janv. 1994
528.73 mln.
+238.9 mln.
82.43%
1 janv. 1995
651.316 mln.
+122.586 mln.
23.18%
1 janv. 1996
717.672 mln.
+66.356 mln.
10.19%
1 janv. 1997
1.181 mds
+463.184 mln.
64.54%
1 janv. 1998
1.136 mds
-44.615 mln.
-3.78%
1 janv. 1999
1.207 mds
+70.759 mln.
6.23%
1 janv. 2000
1.172 mds
-35.4 mln.
-2.93%
1 janv. 2001
1.022 mds
-149.41 mln.
-12.75%
1 janv. 2002
1.081 mds
+59.092 mln.
5.78%
1 janv. 2003
1.188 mds
+107.006 mln.
9.9%
1 janv. 2004
1.702 mds
+513.701 mln.
43.23%
1 janv. 2005
2.024 mds
+321.582 mln.
18.89%
1 janv. 2006
2.468 mds
+444.049 mln.
21.94%
1 janv. 2007
3.034 mds
+566.485 mln.
22.96%
1 janv. 2008
4.375 mds
+1.34 mds
44.18%
1 janv. 2009
5.327 mds
+952.072 mln.
21.76%
1 janv. 2010
4.355 mds
-971.855 mln.
-18.25%
1 janv. 2011
4.007 mds
-347.83 mln.
-7.99%
1 janv. 2012
4.792 mds
+785.031 mln.
19.59%
1 janv. 2013
4.801 mds
+9.472 mln.
0.2%
1 janv. 2014
5.142 mds
+340.437 mln.
7.09%
1 janv. 2015
5.064 mds
-77.82 mln.
-1.51%
1 janv. 2016
4.437 mds
-626.746 mln.
-12.38%
Classement des pays selon les statistiques actuelles par années