30
/fr/
AIzaSyAYiBZKx7MnpbEhh9jyipgxe19OcubqV5w
April 1, 2024
172579
Kyrgyz Republic
KGZ
true
2
1
Commercial service exports (current US$)
2016,2015,2014,2013,2012,2011,2010,2009,2008,2007,2006,2005,2004,2003,2002,2001,2000,1999,1998,1997,1996,1995,1994
Download
Bibliothèque de statistiques globales →Kyrgyz Republic →

Commercial service exports (current US$)

Cette statistique dans les autres pays:

AfghanistanAlbaniaAlgeriaAngolaAntigua and BarbudaArab WorldArgentinaArmeniaArubaAustraliaAustriaAzerbaijanBahamas, TheBahrainBangladeshBarbadosBelarusBelgiumBelizeBeninBermudaBhutanBoliviaBosnia and HerzegovinaBotswanaBrazilBrunei DarussalamBulgariaBurkina FasoBurundiCabo VerdeCambodiaCameroonCanadaCaribbean small statesCentral African RepublicCentral Europe and the BalticsChadChileChinaColombiaComorosCongo, Dem. Rep.Congo, Rep.Costa RicaCote d'IvoireCroatiaCuracaoCyprusCzech RepublicDenmarkDjiboutiDominicaDominican RepublicEarly-demographic dividendEast Asia & PacificEast Asia & Pacific (excluding high income)East Asia & Pacific (IDA & IBRD countries)EcuadorEgypt, Arab Rep.El SalvadorEquatorial GuineaEritreaEstoniaEthiopiaEuro areaEurope & Central AsiaEurope & Central Asia (excluding high income)Europe & Central Asia (IDA & IBRD countries)European UnionFaroe IslandsFijiFinlandFragile and conflict affected situationsFranceFrench PolynesiaGabonGambia, TheGeorgiaGermanyGhanaGreeceGrenadaGuatemalaGuineaGuinea-BissauGuyanaHaitiHeavily indebted poor countries (HIPC)High incomeHondurasHong Kong SAR, ChinaHungaryIBRD onlyIcelandIDA & IBRD totalIDA blendIDA onlyIDA totalIndiaIndonesiaIran, Islamic Rep.IraqIrelandIsraelItalyJamaicaJapanJordanKazakhstanKenyaKiribatiKorea, Rep.KosovoKuwaitKyrgyz RepublicLao PDRLate-demographic dividendLatin America & Caribbean Latin America & Caribbean (excluding high income)Latin America & the Caribbean (IDA & IBRD countries)LatviaLeast developed countries: UN classificationLebanonLesothoLiberiaLibyaLithuaniaLow & middle incomeLow incomeLower middle incomeLuxembourgMacao SAR, ChinaMacedonia, FYRMadagascarMalawiMalaysiaMaldivesMaliMaltaMarshall IslandsMauritaniaMauritiusMexicoMicronesia, Fed. Sts.Middle East & North Africa (excluding high income)Middle East & North Africa (IDA & IBRD countries)Middle incomeMoldovaMongoliaMontenegroMoroccoMozambiqueMyanmarNamibiaNepalNetherlandsNew CaledoniaNew ZealandNicaraguaNigerNigeriaNorth AmericaNorwayOECD membersOmanPacific island small statesPakistanPalauPanamaPapua New GuineaParaguayPeruPhilippinesPolandPortugalPost-demographic dividendPre-demographic dividendQatarRomaniaRussian FederationRwandaSamoaSao Tome and PrincipeSaudi ArabiaSenegalSerbiaSeychellesSierra LeoneSingaporeSint Maarten (Dutch part)Slovak RepublicSloveniaSolomon IslandsSouth AfricaSouth AsiaSouth Asia (IDA & IBRD)South SudanSpainSri LankaSt. Kitts and NevisSt. LuciaSt. Vincent and the GrenadinesSub-Saharan Africa Sub-Saharan Africa (excluding high income)Sub-Saharan Africa (IDA & IBRD countries)SudanSurinameSwazilandSwedenSwitzerlandSyrian Arab RepublicTajikistanTanzaniaThailandTimor-LesteTogoTongaTrinidad and TobagoTunisiaTurkeyTuvaluUgandaUkraineUnited KingdomUnited StatesUpper middle incomeUruguayVanuatuVenezuela, RBVietnamWest Bank and GazaWorldYemen, Rep.ZambiaZimbabwe

La ligne de temps

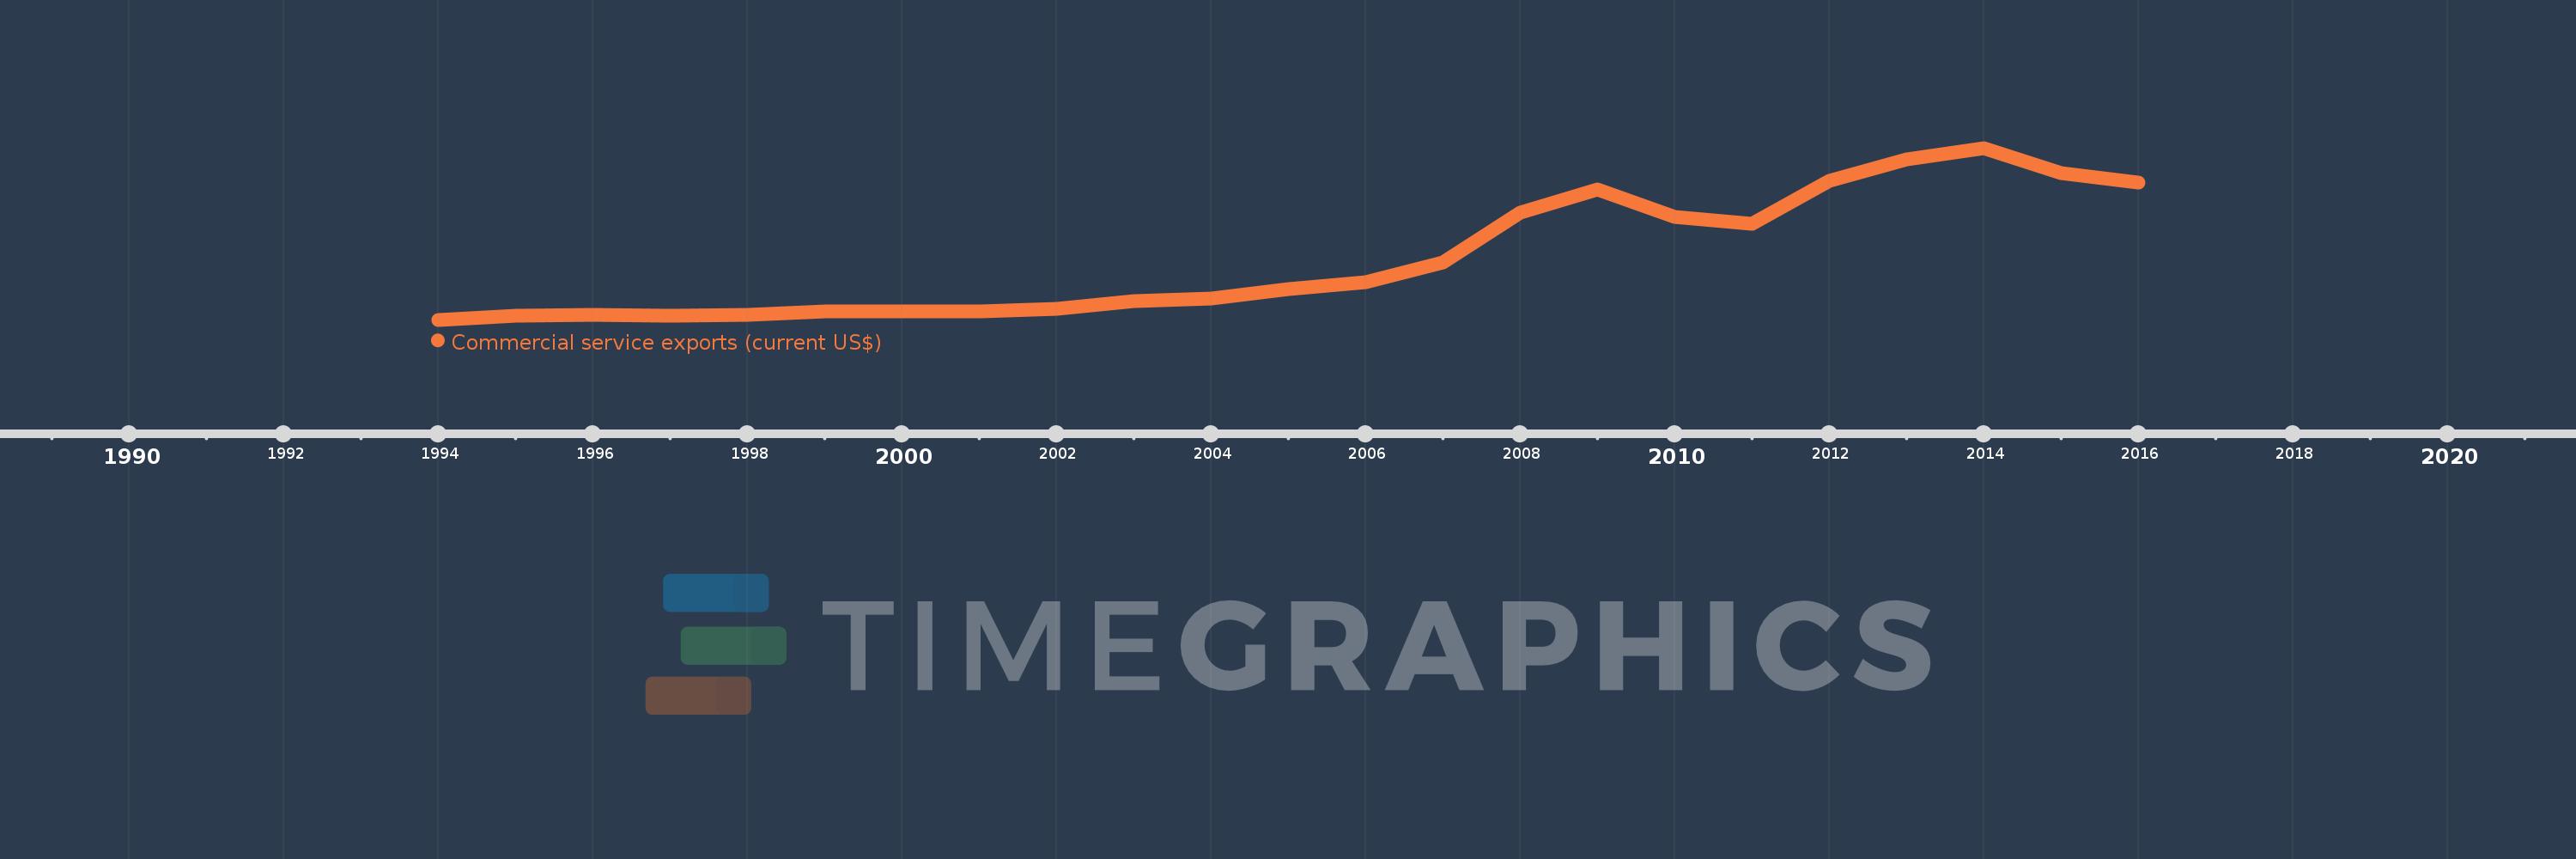
Cette échelle de temps montre un graphique de 1994 année à 2016 année Kyrgyz Republic. Les données jusqu'à 1993 année ne sont pas présentés. Quantité d'observations actuelles selon dates: 23.

Source (désignation):

Les indicateurs du développement mondiale

Source (organisation):

International Monetary Fund, Balance of Payments Statistics Yearbook and data files.

Catégories:

Private Sector, Trade

Dernière mise à jour

23 avr. 2017

Les indicateurs de changement de valeurs selon les années

En moyenne:
377.891 mln.
Minimum:
8.685 mln.
1 janv. 1994
Maximum:
1.043 mds
1 janv. 2014
Pour la date d''observation
Valeur
Changement absolu
Le changement par rapport à la valeur précédente
1 janv. 1994
8.685 mln.
+8.685 mln.
0.0%
1 janv. 1995
32.667 mln.
+23.982 mln.
276.13%
1 janv. 1996
39.152 mln.
+6.485 mln.
19.85%
1 janv. 1997
31.49 mln.
-7.662 mln.
-19.57%
1 janv. 1998
40.1 mln.
+8.61 mln.
27.34%
1 janv. 1999
58.026 mln.
+17.926 mln.
44.7%
1 janv. 2000
60.309 mln.
+2.283 mln.
3.94%
1 janv. 2001
57.177 mln.
-3.133 mln.
-5.19%
1 janv. 2002
75.867 mln.
+18.691 mln.
32.69%
1 janv. 2003
120.105 mln.
+44.237 mln.
58.31%
1 janv. 2004
137.012 mln.
+16.908 mln.
14.08%
1 janv. 2005
192.533 mln.
+55.52 mln.
40.52%
1 janv. 2006
233.544 mln.
+41.011 mln.
21.3%
1 janv. 2007
351.405 mln.
+117.861 mln.
50.47%
1 janv. 2008
654.046 mln.
+302.642 mln.
86.12%
1 janv. 2009
794.868 mln.
+140.821 mln.
21.53%
1 janv. 2010
627.901 mln.
-166.967 mln.
-21.01%
1 janv. 2011
585.531 mln.
-42.37 mln.
-6.75%
1 janv. 2012
846.074 mln.
+260.543 mln.
44.5%
1 janv. 2013
971.838 mln.
+125.763 mln.
14.86%
1 janv. 2014
1.043 mds
+71.314 mln.
7.34%
1 janv. 2015
893.815 mln.
-149.337 mln.
-14.32%
1 janv. 2016
836.201 mln.
-57.614 mln.
-6.45%

Classement des pays selon les statistiques actuelles par années